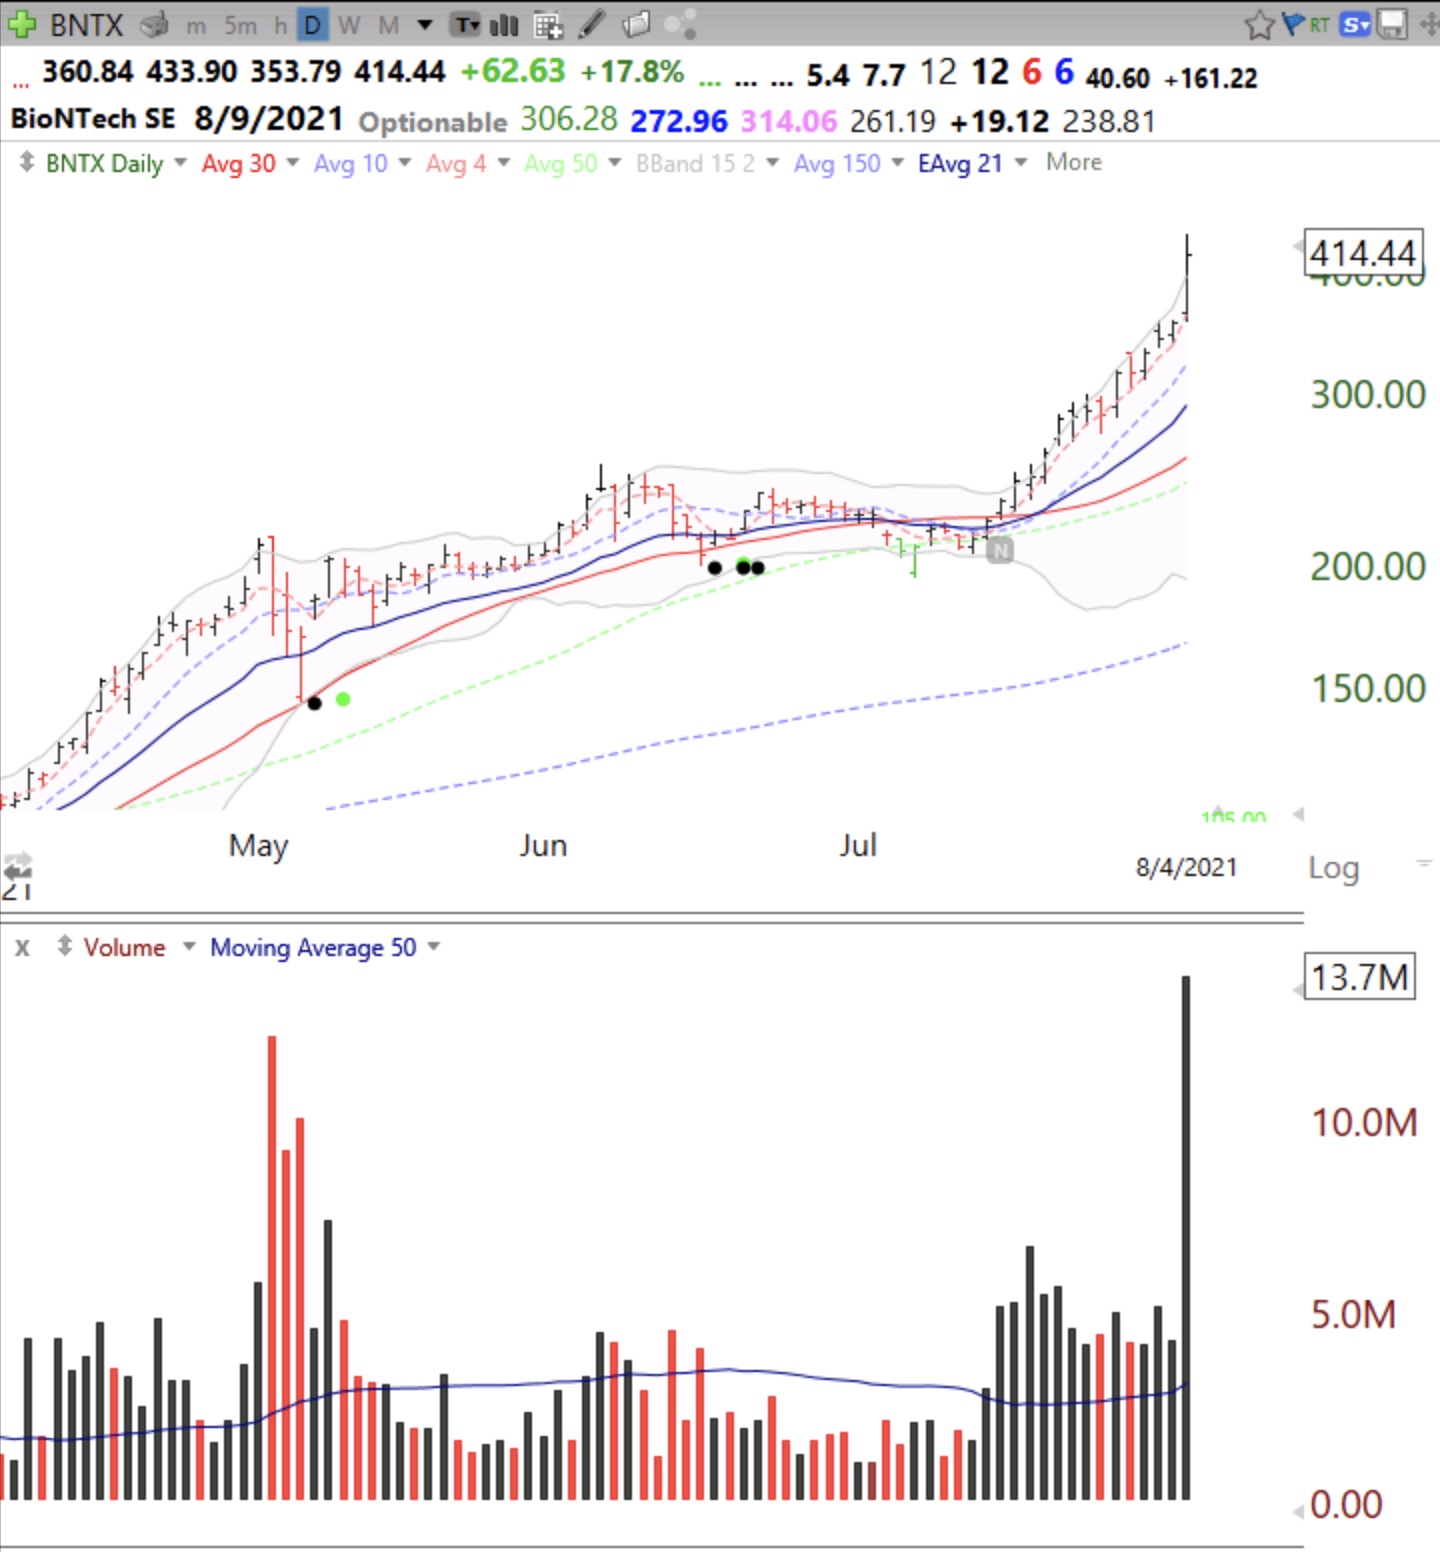
When a stock that has been on a tear has a large gain on the highest volume in many days it can be a sign of a top. Note that it is extended outside the upper 15.2 daily Bollinger band. The “N” shows when BNTX triggered my oversold bounce signal (OSB) after a VCP and I started buying it. Note the prior black and green dot signals.
How is the “N” oversold bounce signal (OSB) different from you green and black dot indicator? Could you please share how you define it and perhaps the TC2000 formula? Would be much appreciated!
the “N” shows where the user of TC2000 (Dr. Wish) entered a note. I would hazard it may have been a note reminding him to blog about it and what to blog about. just a guess.