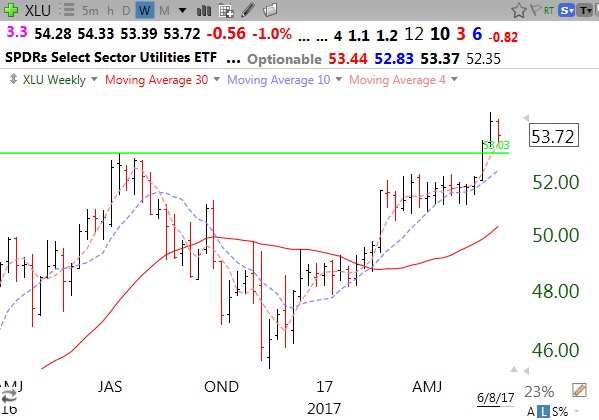
It looks like the utilities ETF had a cup with handle break-out (GLB) to all time highs. This suggests lower interest rates to come? This is a weekly chart.
2 thoughts on “34th day of $QQQ short term up-trend; GLB: $XLU = lower rates?”
I’m closely following your converting from daily to weekly charts. Like you, I am also about to retire and concerned about maximizing my retirement money, yet keeping it safe from loss.
I held XLU for the past couple of weeks and made a slight bit of money, around one per cent – however, it was stopped out yesterday. I set the stop point using the Guppy CBL (Count Back Lines) method on Daily Charts. It’s interesting comparing this to your use of Weekly Charts showing a GLB.
I’m trading using money in some smaller IRAs in preparation for getting the money out of my much larger 401K in the next year or two as I retire. I’m observing your use of Weekly versus Daily charts with a great bit of interest.
Thanks for all the info you provide – it was via Wishing Wealth that I found out about Daryl Guppy and his trading methods using GMMA and CBL.
Keep up the good work!!!!!
brew
Loading...
So am I–the jury is still out on weekly versus daily.
I’m closely following your converting from daily to weekly charts. Like you, I am also about to retire and concerned about maximizing my retirement money, yet keeping it safe from loss.
I held XLU for the past couple of weeks and made a slight bit of money, around one per cent – however, it was stopped out yesterday. I set the stop point using the Guppy CBL (Count Back Lines) method on Daily Charts. It’s interesting comparing this to your use of Weekly Charts showing a GLB.
I’m trading using money in some smaller IRAs in preparation for getting the money out of my much larger 401K in the next year or two as I retire. I’m observing your use of Weekly versus Daily charts with a great bit of interest.
Thanks for all the info you provide – it was via Wishing Wealth that I found out about Daryl Guppy and his trading methods using GMMA and CBL.
Keep up the good work!!!!!
brew
So am I–the jury is still out on weekly versus daily.