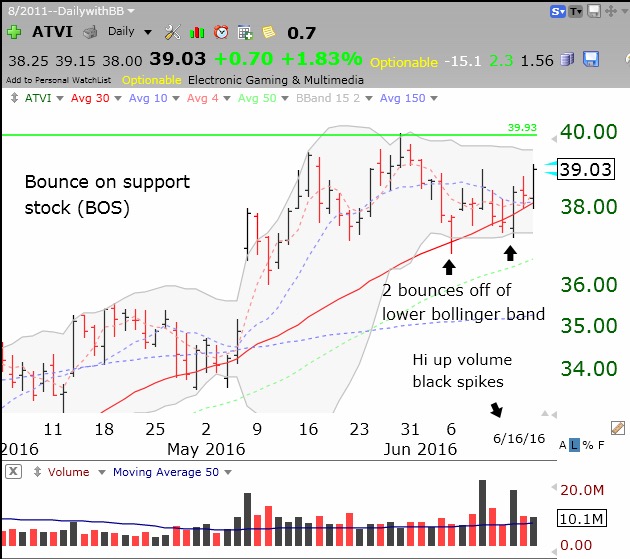
ATVI is showing a lot of strength as a BOS stock finding support on its lower Bollinger Band and its 30 day average (red line). Black volume spikes suggest institutional buying. Next hurdle, breaking through its all-time high at its green line (green line break-out, GLB) and holding it.
The QQQ completed its 16th day of its short term up-trend.
My TC 2000 3 month chart tells me that ATVI peaked out on 5/16/2016. It is slowly getting bearish. It has a high P/E of 34 and that is about 177% higher than average. EPS is down about 12% over the last year. Summary: Just stay away and watch it. Sir Cat Herder.