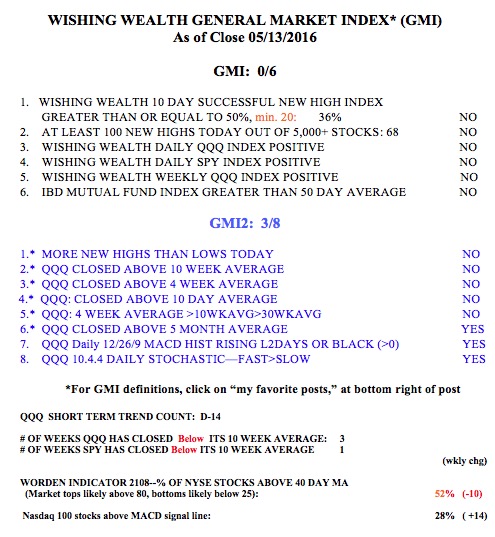
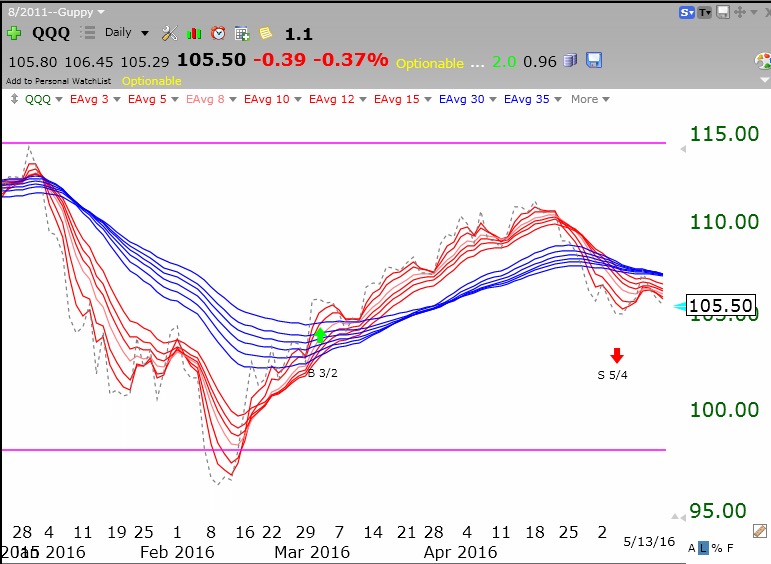
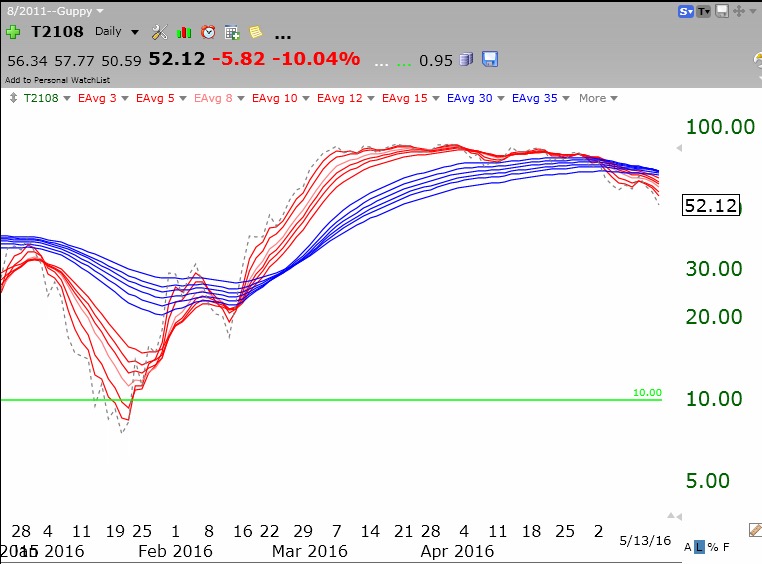
All six of the primary indicators counted in the GMI are negative (see GMI table at bottom). The only positive sign I see is that the put/call ratio on Friday, a contrary indicator now indicating many option traders are bearish, suggests that we could get a quick short term bounce on Monday. But these modified daily Guppy charts of QQQ (Nasdaq 100 ETF) and T2108 (a measure of the % of NYSE stocks that closed above their average price over the past 40 days) suggest that these indicators are turning down. These daily Guppy charts show that the shorter term averages (red) are moving below the longer term averages (blue). Until these averages return to a rising RWB (red/white/blue) pattern, I believe the trend is down.
Here is the GMI table. A GMI reading of zero is for me, a sign of significant market weakness. Note the SPY has now closed below its 10 week average, joining the QQQ. I am a chicken trader and therefore am now mainly in cash in my trading accounts with a small position in SQQQ, a leveraged ETF which is designed to rise 3X as much as the QQQ falls. My first priority is to conserve capital so that I live to trade another day…