Friday’s late reversal threatens to end the QQQ short term up-trend that completed its 29th day on Friday. A down or flat day on Monday could begin a new short term down-trend. However, with the end of the first quarter mutual fund window dressing occurring this week, the market could start off down on Monday and come back strong towards the end of the day and the rest of the week. I will watch the market carefully for signs of a trend change. To hedge my trading account, I have a small position in SQQQ and a somewhat larger position in TQQQ. I will adjust these holdings when the short term trend becomes clearer to me. Short term down-trends often give brief fake-out moves that last only a few days. I am re-posting a chart of the short term up and down trends that I posted in early February. Note that 41% of the 51 down-trends between 2006 and December, 2013 (as I define them) lasted 5 days or less.
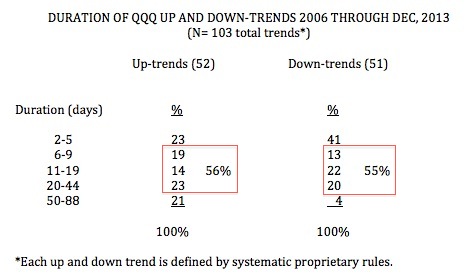 If a short term down-trend begins, I will be more sure of it once it passes day 5 and add more SQQQ then. Another possible scenario is for a bounce later this week, followed by a resumption of a down-trend. Then again, with earnings release season in April, we could see a decline leading to a significant advance when earnings start coming out. Take your pick…..
One source of concern is the topping behavior of the 3D printing stocks that have had a huge bull market run. XONE, ONVO, DDD, and SSYS have all developed weak chart patterns. For example, look at what appears to me to be a head and shoulders top in SSYS in its weekly chart. Note the large red volume spikes, suggesting selling by mutual funds. I drew in a possible neckline which has been penetrated. Another danger sign is that the 30 week average (red line) is now starting to level off.
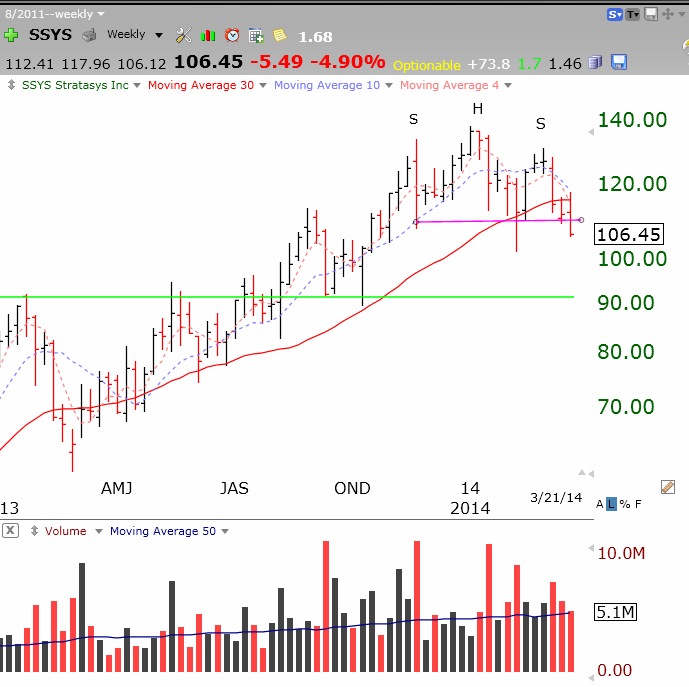
The other three 3D stocks have similar weak chart patterns. Even 3D stocks do not advance forever……………….
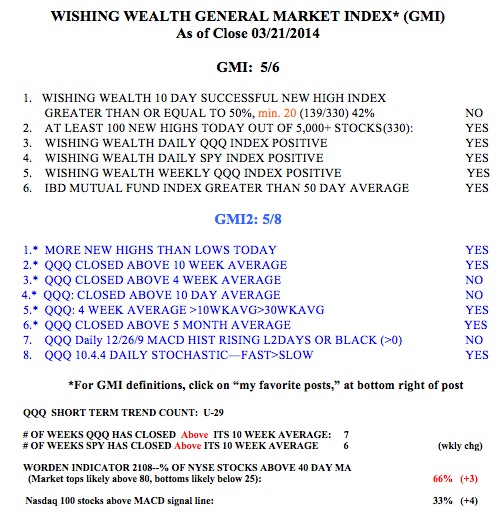
Meanwhile, the GMI is at 5 (of 6) indicating to me a still solid longer term up-trend in the general market. The more sensitive GMI-2 is now at 5 (of 8) reflecting weakness in its very short term components.
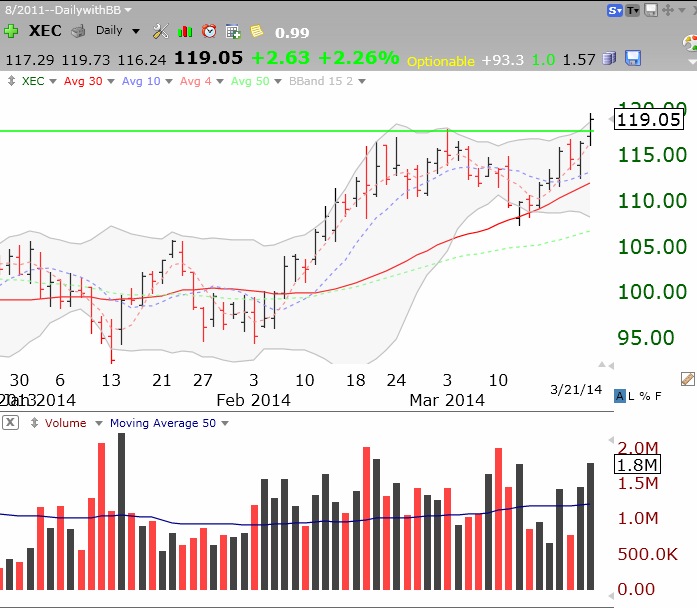
There was an interesting green line break-out stock on Friday, XEC. Check out its daily chart. Any stock that can sprint to an all-time high in a weak market and hold it is worth watching. XEC has an IBD comp rating of 94.
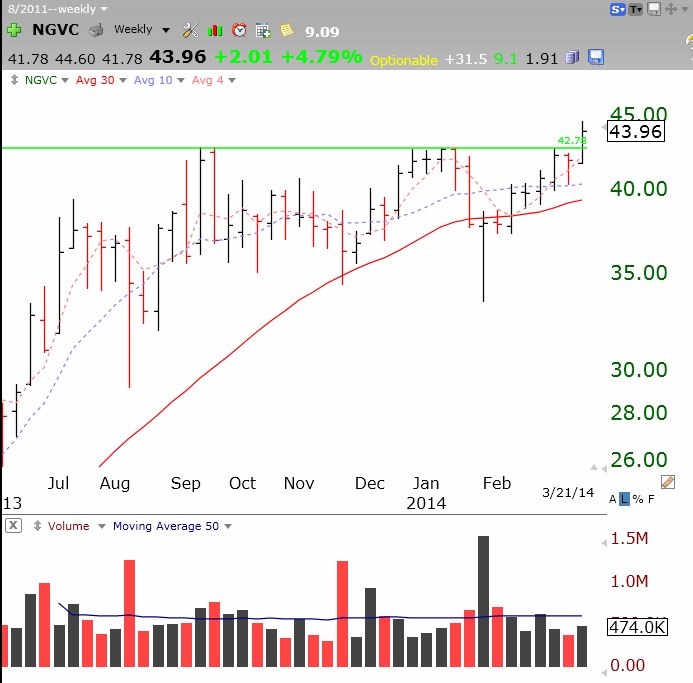
NGVC, an IPO in 2012 also broke its green line last week. Check out its weekly chart. IBD comp rating: 90.
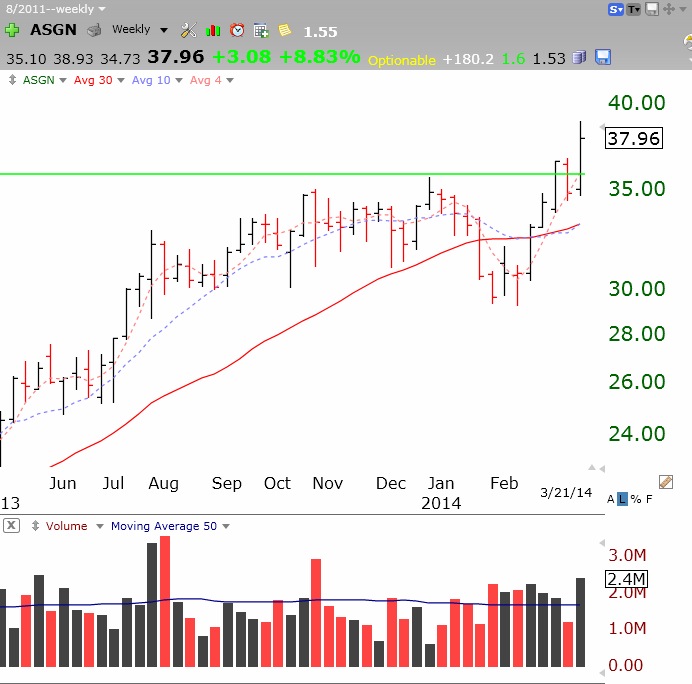
 And ASGN broke its 2000 peak, IBD comp: 95.