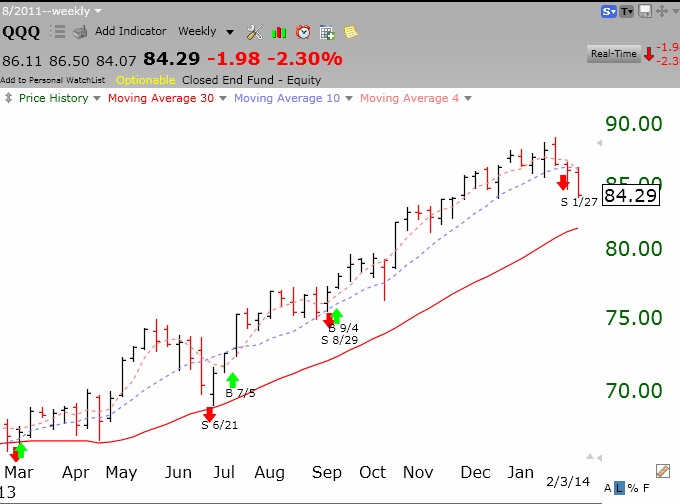
I wrote a few days ago that the market always comes down faster than it goes up. Hence the current sharp decline after many months of an advance. It is nice to be short or in cash in my trading accounts and watching from the sidelines. Unfortunately, I am still invested in mutual funds in my university pension. I will only exit them when it looks like a longer term Stage 4 decline. This weekly chart of the QQQ shows it to remain in a Stage 2 up-trend, well above its rising 30 week average (solid red line).
I expect a bottom when the Worden T2108 falls below 20%. It is currently at 37%.
Dear Dr. Wish.
I have visted your blog for nearly a year. Your blog completely changes my understanding of investments.
I have a question: how do you determine QQQ short term up or down trend? Is it the first day when [Close]<[SMA5], or [MACD Histogram 12 26] < 0 or by counting bars in the chart?
Thank you very much
David
Thanks for sharing!