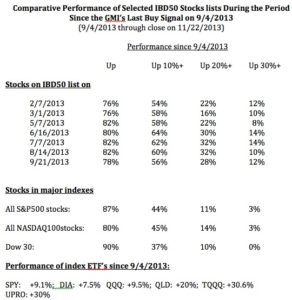
I decided to look at how IBD 50 stocks have performed during the time since September 4, when the GMI issued the buy signal, that is still in effect. I examined seven IBD 50 lists that had been published, beginning with the one from 2/7/3013. Using TC2000 I computed the percentage of the stocks in each IBD list that has advanced in the period from 9/4 through Friday’s close on 11/22. I compared these results to how stocks in three major indexes (S&P 500, Dow 30 and NASDAQ 100) performed during the same period. Finally, I looked at how their respective index ETF’s performed during the same period. I hypothesized that the IBD 50 stocks, which are picked based on the IBD growth stock strategy, would outperform most other stocks. I was surprised by some of the results.
As this table shows, the percentage of stocks in the IBD 50 lists that have gained at all since 9/4, ranged from 76% to 82%. In comparison, 87% of the S&P 500 stocks have gained, 80% of the NASDAQ 100 stocks and 90% of the Dow 30. Thus, IBD 50 stocks as a whole were no more likely to rise than were the stocks in these indexes.
The superiority of the IBD 50 stocks began to show up when I looked at the likelihood of having larger gains. The percentage of IBD 50 stock lists that advanced 10% or more since 9/4 ranged from 54%-62%, much better than the stocks in the three market indexes (37%-45%). The IBD 50 stocks did even better at higher levels of gains. Gains of 20% or more were found in 16%-32% of the IBD 50 stock lists and in no more than 14% of the stocks in the major indexes. Finally, gains of 30% or more were found in a small minority of the IBD 50 lists (8%-14%) but were very rare in the stocks in the general indexes (0%-3%).
Thus, while IBD 50 stocks were not more likely to have gained (at all) as the stocks in the three market indexes studied, they excelled in their likelihood of having larger gains.But that is not the full story.
What would have happened if during this same period, one simply had bought a major index ETF instead of searching for better returns by buying individual stocks? At the bottom of the table are the performance of some major index ETF’s during this same period. Simply buying and holding the SPY would have yielded a return of +9.1%. The DIA was up +7.5% and the QQQ was up 9.5%. The majority of the IBD 50 stocks would have beaten these returns, if one had been able to identify in advance which of the the 54% to 64% of the IBD 50 stocks would gain at least 10%. However, the 2X leveraged QQQ ETF, QLD, advanced 20% and the two 3x leveraged ETF’s, TQQQ and UPRO, gained 30%!
Thus, by merely buying and holding TQQQ or UPRO on 9/4, one would have beaten about 90% of the stocks in the IBD 50. And who is so good a stock picker that s/he could have identified in advance the 4 to 7 stocks out of 50 in on one these IBD50 lists that would have beaten the strategy of just buying and holding the 3X ETF’s? Over the past few years I have had to repeatedly learn the lesson that when the GMI issues a buy signal, I should begin accumulating QLD or TQQQ instead of trying to find the rare stock that will eventually beat them. (Yes, I know that the leveraged ETF’s can fall more quickly, but it is much easier for me to focus on just the action of one market index and to exit quickly when its trend turns.)…
I have added a new and exciting book by Alan Ellman to the list of books to the right of this post. Alan has been teaching folks how to earn income from their portfolios by selling covered calls. Now Alan has turned his attention to teaching high school and college students the basics of stocks investing and how to build a sound retirement. The book is a great introduction for persons who want to learn about both fundamental and technical analysis of stocks. It also has a chapter for young and old investors that explains the ins and outs of taxes. This book will be added to the required reading for my students next semester. By the way, I was honored to write the Foreword for the book and I receive no compensation from its sales, but if you order it from my site, my son and webmaster will benefit. This book would be a great gift for anyone in our lives whom we want to introduce to the stock market….
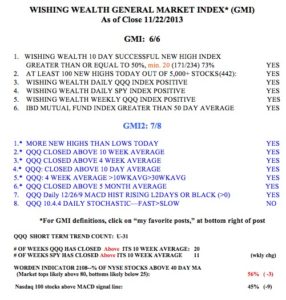
Now for the GMI:

Thanks for the excellent post. In the GMI Table, note that Item 1 under the GMI should be YES rather than NO.
Uh….Is there a discrepancy here?
There was a Sell signal Oct 8th….or am I missing something?
“Going to cash in trading accounts; IBD calls market correction”
Oct 8th 2013
“I decided to look at how IBD 50 stocks have performed during the time since September 4, when the GMI issued the buy signal, that is still in effect.”
?
I sometimes go to cash in my trading account even though the GMI buy signal is still in place. There are many short term down-trends that occur within a longer term up-trend. The GMI focuses on the longer term trend. I never go to cash in my more conservative university pension until the GMI is zero and on a Sell.
Thanks again, Rick.
Thanks Dr Wish.
So you’ve been holding QLD or TQQQ since Sep 4?
I’m assuming this is true since the title of the post is
“GMI based strategy using 3X ETF’s beats IBD 50 stocks”
And….if the longer term trend is still in place, what’s the point of going in and out on the shorter term trends? Is it really advantageous financially? Why not just stay in?
In other words:
Assuming you only trade the 3X ETFs in your trading account, and went to cash on Oct 8th, when did you get back in, and how does this compare to the Sep 4th buy and hold?
Thanks for all you do, it is appreciated!