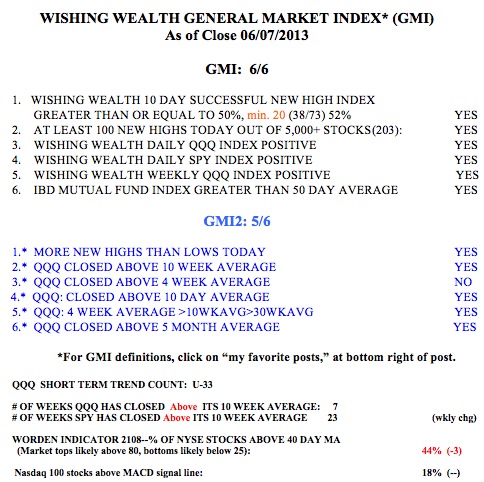
With the GMI back to 6 (of 6) I am looking to initiate more long positions. I bought some TQQQ on the bounce on Friday. I will add to it if the market continues higher.
During my vacation, I visited Powell’s Books in Portland, Oregon, one of the largest bookstores I have ever been in. They sell new and used books and I happened to find an old trading book (Guide to Conquering the Trading Markets) that described an interesting strategy for managing risk and setting stops. I later found an updated description of the method on the web. (However, the original description said that once half of the position was sold, move the stop on the remaining shares up to their original purchase price. That way, some of the gain is retained even if one is stopped out.) I am going to teach my students this method of trading next semester. Check it out here. Many of my students take a position, see it gain, and then give it all back and more when the stock declines. This method helps one to minimize losses and retain gains. I think it is very elegant……
You may have noted that my site has a link (to the right) to the darkliquidity site, which compares the performance of various market timing systems. Using my GMI signals to trade the leveraged bullish NASDAQ 100 Index ETF, QLD, is leading all systems this year, as it also did in 2012. You can check out this analysis by clicking here. I find repeatedly, and have posted many times, that a strategy of simply buying and holding a leveraged bullish ETF during a sustained up-trend beats trying to find the rare individual stocks that will do better. The key is to gradually enter the ETF as it climbs and to have strict rules to sell out promptly when it begins a sustained decline. By definition, these leveraged ETFs rise and fall much faster then their underlying index. I buy the SQQQ when the GMI gives a Sell Signal and the NASDAQ 100 Index begins to decline. Since the GMI flashed a Buy Signal on February 28, the TQQQ has advanced +28.6%, while the QQQ has advanced +9.4%. Only 7 of the NASDAQ 100 stocks advanced more than 29% during this same period, and many of them did not move much until May, suggesting one needed a lot of patience to hold them. Do we want to spend (waste?) our time searching for the 7% of stocks that will out-perform just holding the TQQQ?
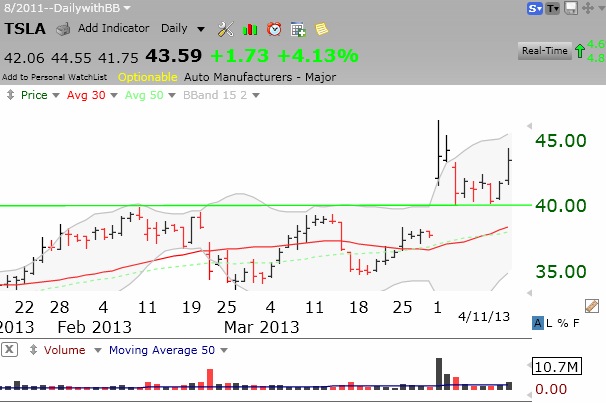
Speaking of stocks that greatly outperform, TSLA has had a huge break-out, more than doubling in price in about two months. Consumer Reports just gave their car the highest rating possible. Perhaps some traders knew in advance that this would happen. How could we have identified this stock before it doubled?
By analyzing past winners, one can design rules for detecting new winners and getting on board at the right time. This daily chart shows what TSLA looked like shortly after its break-out in early April. Note that TSLA gapped up to a new all-time high (evidenced by trading above its green line top of $39.95 set in March. 2012) on extremely high trading volume. This critical move could have been identified by simply looking over the charts of stocks hitting new price highs on that day. During the 6 days following the break-out, TSLA re-tested the break-out by settling back to the green line (prior peak) where buyers came back in and supported the price. The stock then continued rising to a high of $114.90. I use TC2000 to scan the new high list each night for stocks that are breaking above a green line top or another multi-week base on unusually high volume. This is where I might find the next TSLA.
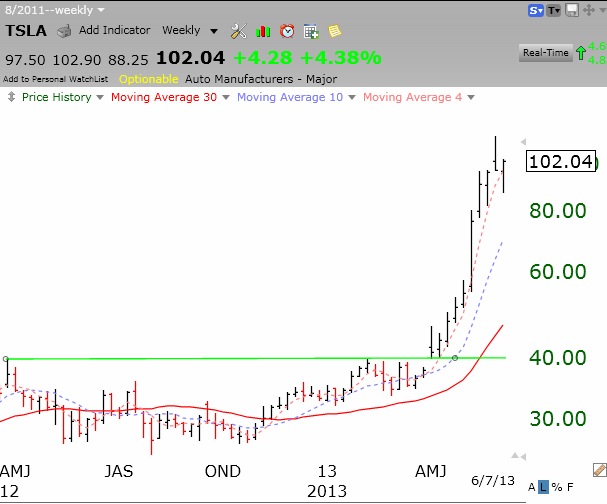
This weekly chart shows what TSLA did after the break-out. By definition, the new high list is where all true winners must appear over and over as they rocket to new heights. Since its break-out on April 1, I calculate that TSLA has hit a new high on 14 of 49 trading days.
I want to thank you for all the wonderful ideas you disseminate to the investing world.
I have question: Dark Liquidity tracks the GMI system as a long only system. In today’s blog post you mention investing in an inverse etf (SQQQ) when the GMI issues a sell signal. Do you think that going short when the GMI is on a sell will be more profitable over time than going to cash?
Thank you for your nice comment. In theory your are right that one could improve his/her return by owning SQQQ during down markets. If you catch a lengthy bear decline, you would have huge profits. Declines are more emotional and can snap back quickly, so I have found them harder to trade. Good luck!
Hey Dr. Wish,
Hope vacation was restful. To Alex’s and to add to Dr. Wish’s point, the triple short etfs should always be traded on secondary indicators like RSI, MACD, and Stoichastic. In addition, they should be traded in correlation to market conditions, In addition, it is always best to add in increments when trading these types of ETFs. As always, trade them well.
If it works as you say, it will be wonderful. However, what happened with the old says: The past is not the key to the future?
The key assumption of all technical analysis is that the stock market is neither deterministic nor random, but somewhere in between. In other words, the futures in not knowable in absolute terms, but in probabilistic ones.
If you believe that the past is not the key to the future, then you should either not invest or buy-and-hold. But, I don’t think that you are right.