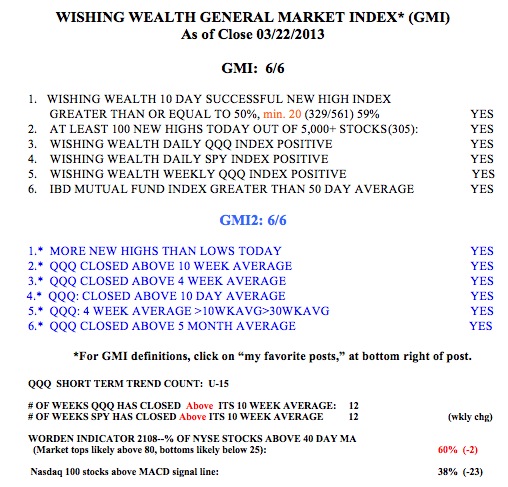
AAPL is beginning to show some technical strength. For the first time since September, it has now closed above its 10 week average. In the past, I made money by owning AAPL as long as it was above its 10 week average. This weekly chart shows that AAPL found support at a prior green line top. While I prefer to buy a stock that is trading above its last green line top (a base at an all-time high), I am becoming interested in AAPL. The sell-off may have been overdone and the coming week is the end of the quarter when mutual funds dress up their portfolios for their quarterly reports. At the end of 2011, AAPL came back to a prior green line and then mounted a huge rally. Will history repeat?
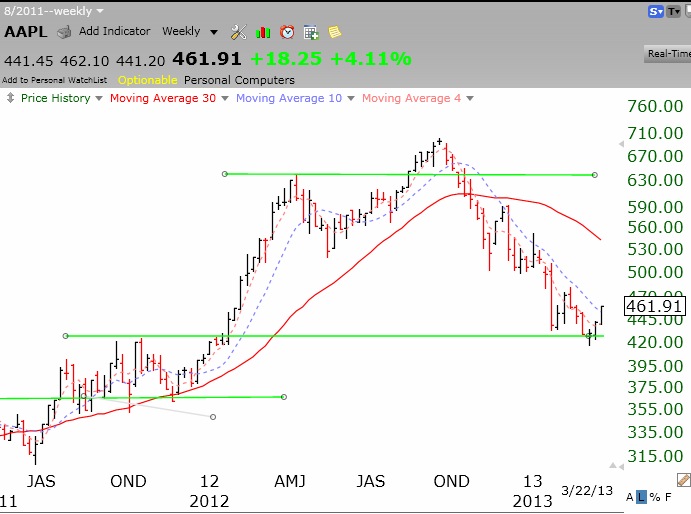
We are likely to see buying in a lot of other stocks that have done well. I am keeping an eye on LKND and GOOG…. I ran a scan looking for stocks in an up-trend that may have bounced up off of support on Friday. Five stocks came up: FCFS, VRSN, CMCSA, V and APH. All but APH have appeared in one of my watchlists containing stocks noted by IBD at some point. All are above their most recent green line tops. If I bought one, I would place my sell stop below Friday’s low. As an example, look at the daily chart of FCFS.
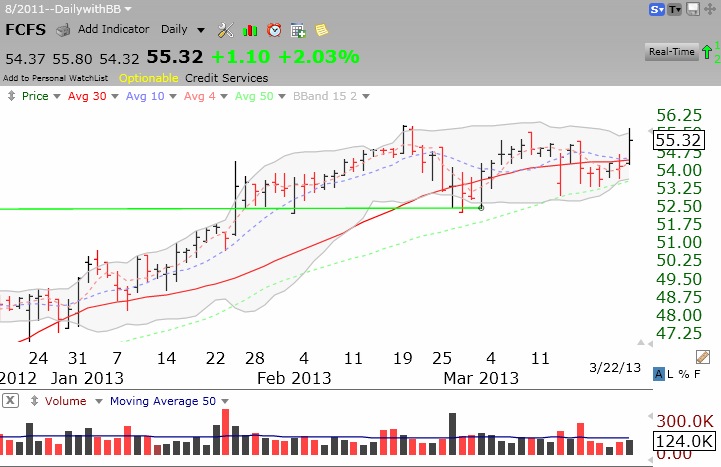
FCFS also has a beautiful RWB pattern in its weekly Guppy GMMA chart.
FCFS may challenge its all-time high of 55.93 and break through its Bolinger Band. Of course, like any stock, its strength will depend on that of the market.
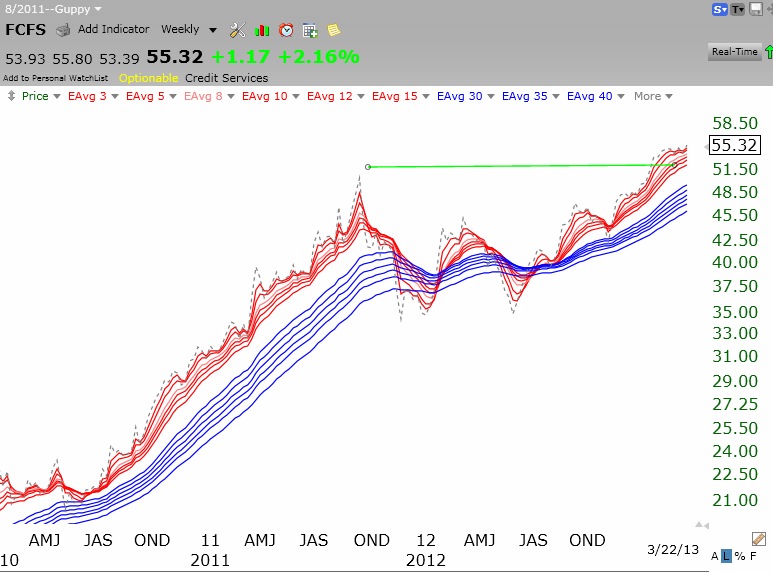
Speaking of the general market, the GMI remains strong. All of my indicators are positive. The Worden T2108 indicator is at 60%, in neutral territory. Friday was the 15th day (U-15) of the current QQQ short term up-trend.