This is a very volatile market. Time to be cautious even though the QQQ remains in a short and longer term up-trend. This is not the time to make large bets.
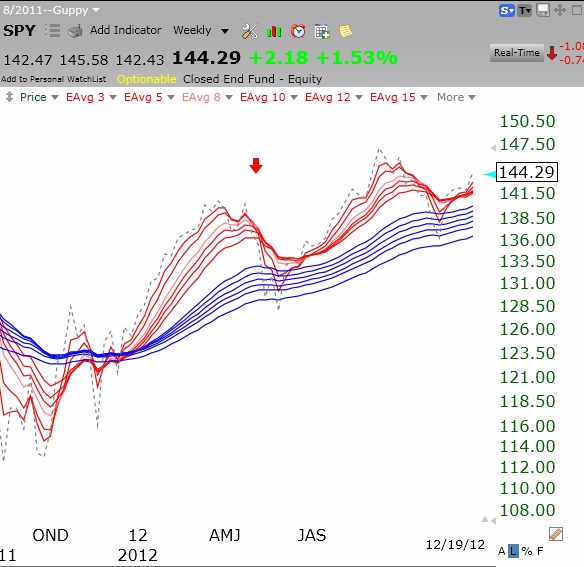
This weekly Guppy GMMA chart of the SPY shows a bullish RWB pattern. The large cap nontech stocks represented in this index ETF (S&P 500) are stronger than the growth stocks represented in the QQQ. It looks like the SPY is moving up after a period of consolidation. All of the shorter term averages (red) are rising above the longer term averages (blue).
It was curious to see you use weekly data with the GMMA. With the concept being you are tracking the behavior of Traders vs Investors — is not that relationship lost with weekly data. Guppy does not address weekly data in his book Trend Trading nor his website. As he does describe his indicator as being “fractal”, maybe the period (day/week) is mute!
I have never understood Guppy’s assertion that longer term averages represent Investors and shorter term averages represent Traders. By definition,the longer averages contain all of the data in the shorter averages. The idea that averages of different lengths represent different types of people makes no intuitive sense to me. As for the weekly time frame in my chart, I use any set-up that appears useful to my trading.