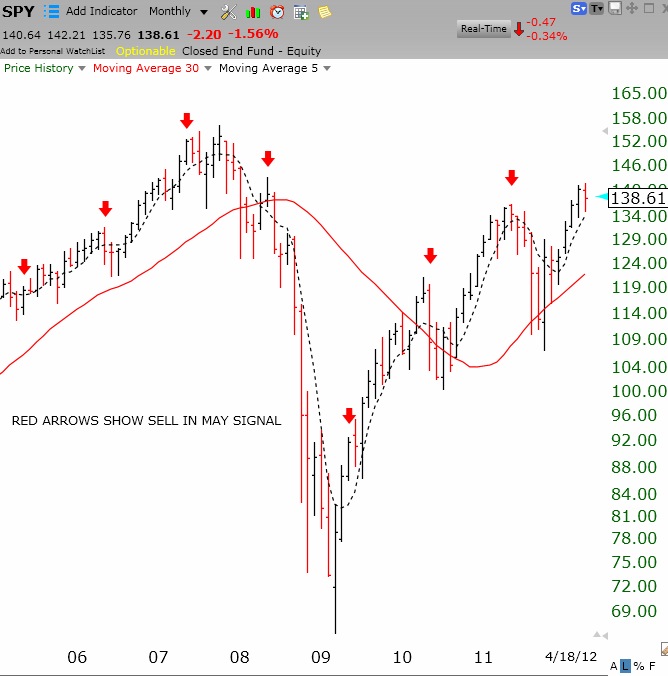
I will be more confident of this new QQQ short term down-trend if it can last two more days. I remain in cash and short gold in my trading accounts and invested long in mutual funds in my university pension. After earnings are out, we approach the dreaded, “Sell in May and Go Away,” period. This monthly chart of the SPY suggests to me that since 2005, in periods when the market had been rising for months leading up to May (like the present), with the exception of the strong rebound from the decline of 2008, the market has stumbled in the period after May. What do you see? Click on chart to enlarge.
Using the last 5 years as a basis for an ongoing trend is not wise since it is a statistical anomaly. A counter point to the Sell In May strategy was written by [http://news.morningstar.com/articlenet/SubmissionsArticle.aspx?submissionid=140646.xml]. While I do personally remain skeptical of the possibility that there will be no swoon for a minor downturn, it is very much so worth noting that Consumer leverage is at extraordinarily low levels and reached it rather rapidly. To compare it, its similar to the T2108 being in oversold territory, but this can be a stronger reaction since people will not want to pass up future gains. Anyways, worth mentioning.
It seems the instructions for inline tags are misleading, the article that is linked to is written by Oppenheimer Funds
Don’t trust other people’s instincts. They are dangerous. For example, prior to the 29 dollar bounce in apple on Tuesday, every analyst came up with some reason for the sell off. They made apple a broken company from a darling according to their reports. Well, I guess they got some egg on their face after that. Apple was the perfect contrarian play on tuesday. I nice bounce off its 30 day MA and an oversold stoichastic(10,4,4). Listen to you technicals, not fund managers articles. They are intended to be misleading.
Perhaps the usefulness of the indicator is best seen by looking at how it behaved in the last 7 signals in the recent past. Some of these indicators may simply work because people believe they are valid. The most recent history may give us a better idea of current beliefs.
If I was to look at the indicator in a historically statistical accurate manner, I would probably only look at the first three data points provided in the picture since that represents an environment of most similar factors to the other data points in order for a trend to form. Taking the most recent data points, I don’t think provides the clearest picture since environmental factors have changed so drastically and so many times in the past 4 years. Its like if I was to do an experiment on soda sweetness over the lifetime of Pepsi soft drink products. They’ve introduced many different sodas over the years and some more recently than others, some have more sugar than others (Diet, Regular, Mountain Dew). Environmental changes like those affect the overall trend.
Again, my belief here is that the “Sell in May” swoon will happen again, just because people will believe it will happen, so the number of people on the Sell side of the Buy-Sell book will increase. Leading to that decrease. The important thing in the usability of this indicator is the magnitude and taking the past 5 years the variance in magnitude is rather large with 2009 being a data point to the complete contrary of the indicator. If we were to take an arbitrary view point, it looks like anything if at all is that the result after the indicator would be similar to the first 3 datapoints since the market has not gone up very rapidly in comparison.
About the chart: The Past is NOT the Key to the Future!!!