With the GMI at zero, the long and short market trends remain down. However, this is not the time to initiate shorts. 86% of the Nasdaq 100 stocks have an oversold daily stochastic below 20. 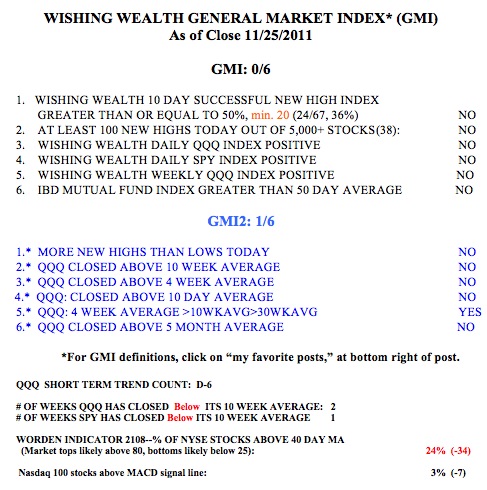 And the Worden T2108 Indicator is now nearing oversold territory, with a value of 24%. A bounce from oversold could occur at any time…..
The QQQ and SPY are now below their 10 week averages. Only 3% of Nasdaq 100 stocks closed with their MACD above its signal line, a sign of short term weakness. Daily new lows were more than six times more prevalent than new highs. Only one stock has good fundamentals and has been repeatedly hitting new highs–ASPS. I wrote about ASPS some time ago. I have a small long, fully hedged position in ASPS………
Meanwhile, another powerful former market leader is entering a likely Stage 4 decline. While it is still too early to be certain, CMG closed last week below its 30 week average. With the exception of one brief period last August, CMG has closed above its rising 30 week average since late 2009. During that time CMG has quadrupled. If its 10 week average should decline below the 30 week average, CMG may be a good short…..
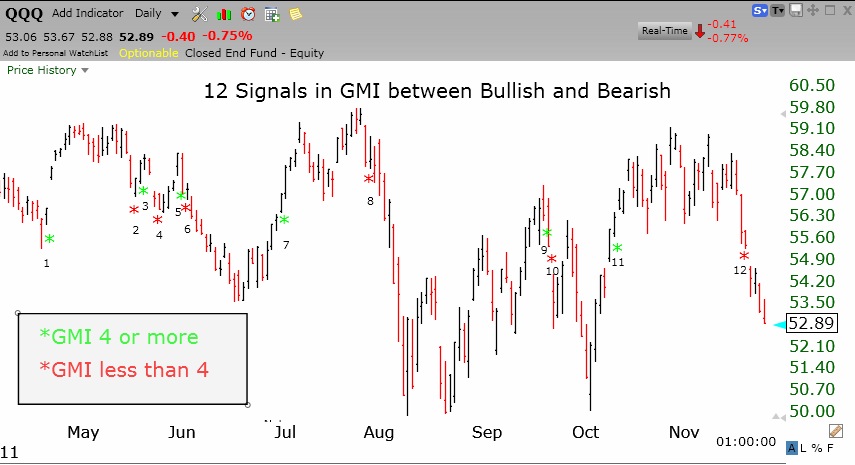
While it has been my experience that the GMI gets me out of the market during major market declines, I thought I would take a systematic look at how the GMI has done recently in a very tough market period. I recorded on this daily chart of the QQQ, each time the GMI signaled a change between bullish and bearish periods. I defined a bullish period as when the GMI closed at 4 or more (out of 6), and a bearish period when it closed below 4. I found that there were 12 trend changes since April 19. I numbered each change on the chart and marked the beginning of a bullish period with a green asterisk and the start of a bearish period with a red asterisk. It is clear that the GMI turned bearish for most of the June decline (signal number 6) and the declines in August (8) and October (10). Note that the current GMI signal is bearish (12). I also discovered that there were several signals of a change in trend that lasted only one day (2 and 3; 5 and 6; 9 and 10). If I had used a rule that said that a change in trend had to persist for two days to be valid, I would have avoided these false signals. I will use that rule when I write about future changes in the market trend. Click on chart to enlarge.
I would be very interested in receiving your comments on my analysis of the GMI’s recent performance. One of my students is conducting a similar analysis over the past 5 years.
Dr. Wish……Thank you for sharing. It would be interesting to know the $ win/loss following the GMI. I’m anxious to hear the results of the 5 year backtest. Keep up the good work.
You have a trend following system and there is no trend? For the first time in years, it seems you need to trade the market off of overbought and oversold indicators; and not trend following indicators. Very strange. I love your site. Excellent work.
It appears that the signals are clear and useful. I know they have helped me in my decision-making. Thank you for your work.