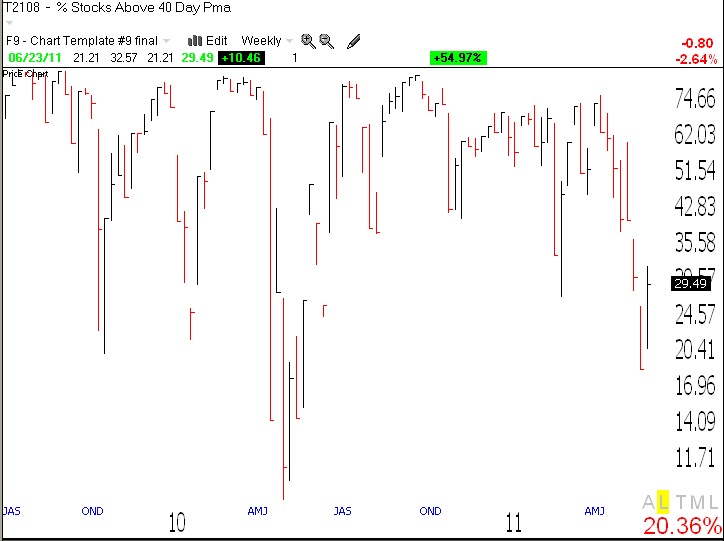
IBD still maintains “market in correction.” Many of my internal indicators show that we have come back from being severely oversold. For example, 53% of the Nasdaq 100 stocks now have their MACD above its signal line, up from a recent low of 5%. 93% have their slow stochastic above their long, up from 6%. Both of these indicators are sensitive to very short term moves.The Worden T2108 indicator looks like it has gotten down to levels reached at recent bottoms, see weekly chart below. I just have to wait to see if this bounce can turn the indicators in my GMI and GMI2 positive. Time will tell. Meanwhile, I enjoy life on the sidelines.
a question about items one and two of the above. do you manually scan each of the 100 stocks in order to see how the indicators are doing?. or is there a software which scans them. or a website, something similar to indexindicators.com . or does worden have these indicators. thanks.
i know stockcharts.com and worden have t 2108 or it’s equivalent. but the first two are i don’t know where to find them. i’m sure most readers rely on you. :>)
Leon: These are among the indicators I personally create and monitor using TC2007.