I received few comments regarding my trading philosophy. Does that mean you all agree with me? Your comments really do make a difference and inspire me to continue this blog. So, please keep them coming. In a few weeks I will begin teaching two courses on TA at the University of Maryland. I expect that many of my students will be following this blog and I will probably post more content. The GMI is at
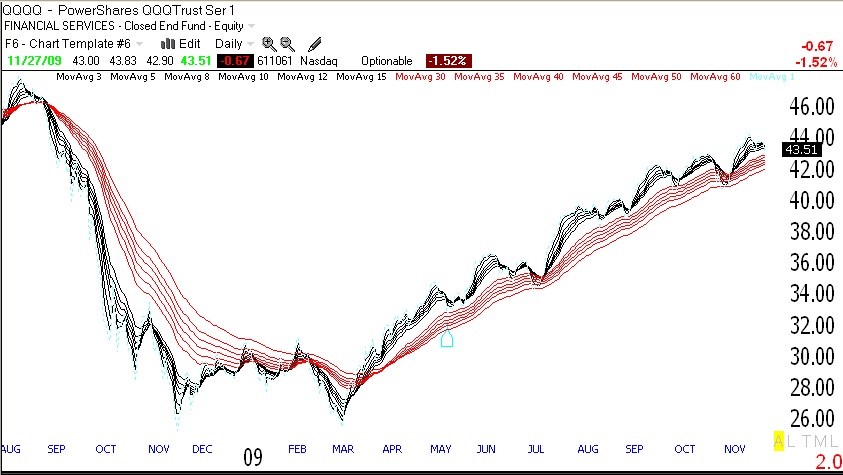
5 and the more sensitive GMI-R is at 8. 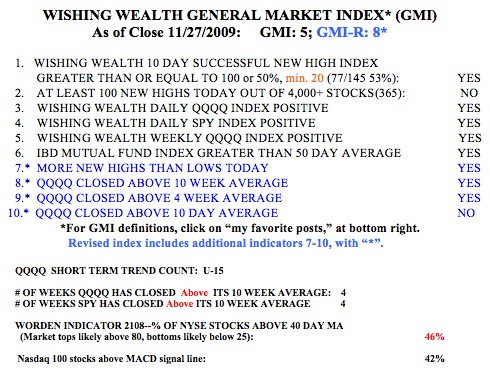 The QQQQ is in the 15th day of its recent short term up-trend. However, as I wrote last week, the QQQQ’s stochastics were in a down-trend and are now low enough such that the QQQQ may be ready to turn up again. What I have noticed, however, is that if I had ignored the short term trends and merely stayed long with the longer term trends I would have done much better with less stress. The longer term trends have been in a solid Weinstein Stage 2 up-trend since last May. My university pension has therefore grown nicely, as I have been invested in mutual funds since that time. In my IRA, where I trade according to the short term trends, I have hopped in and out of the market and have done less well. Jesse Livermore wrote that it took him a long time to learn that the big money is made in the big swing. Once the up-trend has begun, get in and stay until it ends. The daily Guppy chart of the QQQQ below, (see Guppy’s book, to the lower right) clearly shows the start of the current up-trend (and the prior down-trend). Note that all of the short term averages (in black) have been above the long term averages (red) since March. All of the long term averages are now rising. It does not take a rocket scientist to see the change in trends. Just watch the market’s behavior and ignore everything else–it’s that simple! (This strategy has kept me out of the market during all major declines since 1995.)
thanks for the update on the short term stochastics and guppy charts. i wish you and david luck in the spring as i thoroughly enjoyed the class last spring. i wish i could drop by but i will be abroad (with tom) next semester.
Is there any chance that you would consider taping your classes and thereafter providing the video series to your readers who cannot attend your course. I believe it would be an efficient way to expand your student participation and ensure your philosophies reach a wider audience in an efficient way.
I can only speak for myself but I am sure others would agree, that I would be willing to pay a tuition for this education.
It is just a thought but I would hope it would have serious merit to hopefully be implemented one day, as I feel especially during these market conditions, as having a poor compass
Great posts Dr Wish. I only wish you would not be absent so often for days at a time when the market is fluid, as recently. Then again, I need to train myself from the very short term. Your indicators and trading philosophy are top notch, if somewhat biased toward NAZ and momentum stocks. Those are risky for some of us.
Hi Dr. Wish, great blog. I’m glad to see a university professor teaching trend trading philosophy. It’s a difficult and lonely road to figure out what is the truth in the capital markets. I hope to be in your class soon.
Hello Dr. Wish, great blog !!! Thanks ! I look forward to your posts. Please keep them coming.
A couple of questions, how do you get the Guppy chart ? Is that something that is available on regular (and free) charting software ? What is the QQQQ’s stochastics ? Thanks !
I produce the Guppy chart using the TC2007 charting program. You can use any charting program that lets you put in multiple moving averages. Stochastics is a statistic that looks at the range of a stock’s price over a given period and then assigns a number of 0 to 100 that indicates whether the last price is now at the bottom (0) or top (100) of that range, or in between. For the short term, I like to go long when the 10 day stochastic has been low, especially below 20 and then turns up. I get cautious when it has been above 80 and starts down.
Dr. Wish,
With regard to Proposition 3 of your trading philosophy you state that “one’s success in the market depends on identifying trends.” In research that I am doing for a statistics project, it has become glaringly apparent that many technical indicators rely on the assumption that stock prices are normally distributed. In agreement with your proposition 3, I have found that as stock prices become more stable in a prolonged uptrend they come closer and closer to a normal distribution. Subsequently, many technical indicators (I am looking at Bollinger Bands for my project) provide a significantly strengthened means of determining buy points. However, stock prices being time-series events cannot be normally distributed because they lack independence. Can you explain why this assumption of normal distribution seems to capture price movements given a stable market? Also, along with stability (reduced volatility and a clear directional trend), what are some other prerequisites for identifying an uptrend in which these indicators can be used most effectively? And finally, how do we presage the breakdown of a stable uptrend and the onset of the irrational behavior that renders many indicators useless? Thanks for all the info and keep up the good work with this blog, it has been a tremendous resource.
Wish you would publish daily , even if only two sentences;
you have many followers who have a tough time following only periodic posts;
why not start a fee service that publishes daily for $100 year, 1000 subscribers should be easy;
It would be better if published daily, as another observer said if you are absent, people seem up in the air; I know we could look all of this up, if you take Worden.
Thanks for your efforts,
Jack in Florida
Dr. Wish, or should I say “Sir Silent Knight”, thanks for everything you do on the blog. You bring a unique perspective to the trading/investing blogosphere as a person who is a professional academic and successful trader. Your blog is among my top 5 favorites.
Please don’t shut down your website. I read all of your posts and it has kept me on the right side of my trades.
I too, have had better results this year in my mutual funds than in my trading account for the same reasons as you.
You should consider charging a few bucks,like the KirkReport does, to cover your time and expenses – except for your students, of course.
Hello Dr. Wish…..
Please don’t go away…..You saved my skin back in ’08.
I agree with Frank about a fee-pay video of your classes for the purpose of investor education.I cannot make the classes (live in CT)
I agree also with a fee for blog access to help cover your own time and costs
Oops! I forgot to mention…..
A near-daily posting would be great. Without a recent post from you, I hesitate to buy as I may inadvertently be buying into a downturn