A lot of stocks are beginning to look good. However, there were only 6 new highs and 8 new lows in my universe of 4,000 stocks on Friday. Two of the 6 new highs are stocks on the IBD100 list, CPSI and TNDM. TNDM is at an all-time high and both of these stocks came public within the past 8 years, a prime criterion of past winning stocks, according to IBD founder William O’Neil. I scanned my universe and found 105 stocks that are within 10% of their 52 week highs and that have promising technicals. Among these stocks that are on my IBD100 lists from the past year and that also have last quarterly earnings up 50% or more are: AIPC, GMCR, ALGT, QSII, SXL, JJSF, NFLX and PNRA. I own some of these stocks…
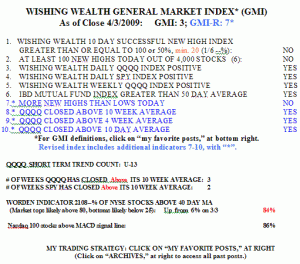
The GMI remains at 4 and the GMI-R is at 7. The IBD Mutual Fund Index is above its 50 day average, indicating to me that growth mutual funds are starting to make money. When these fund managers can make money buying growth stocks, so can I. The Worden T 2108 is now at 84%, heading towards overbought territory, but not a concern to me, given that the market is snapping back from very over-sold readings. Both the QQQQ and SPY have closed above their 10 week averages for several weeks, a key sign of technical strength. While still in longer term down-trends, when these ETF’s are above their 10 week averages, I have usually been able to make money buying stocks.  I currently own QLD and growth stocks like AAPL, QSII, NFLX and GMCR…..
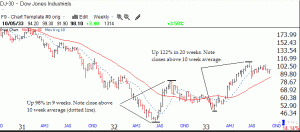
A lot of pundits are comparing the recent “huge” rise in the Dow to the rally that occurred in 1932. So, is this a real market bottom? After declining 90% in a 4 year bear market, the Dow rose 98% in 9 weeks in 1932 and 122% in 10 weeks in 1933. Note that each rally was marked by many weekly closes above the Dow’s rising 10 week average (dotted line).  Closes above the Dow’s 10 week average is a prime characteristic of a bull or rising market. Note, however, that after the large rise in 1932, the market consolidated for about six months as the 30 week average (red line) curved around and the Stage 2 (See Weinstein book to right for stage analysis) bull market began.
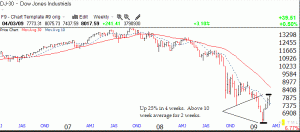
Now look at the current pattern of the Dow. In comparison with the 1932-33 rallies, the “historic rise” thus far is puny, only 25%.  Furthermore, the Dow has closed above its declining 10 week average for only 2 weeks and remains below its declining 30 week average. This means that if this is a real bottom, we probably will see much more of a rise in the coming weeks. 25% is not much of a rally after such a large decline. Furthermore, if this rally continues, we could also see a longer subsequent consolidation like we had in 1933, as the Dow climbs above its 30 week average and this average begins to rise in a new Stage 2 advance. Then, again, as long as the Dow remains above its 10 week average, I am bullish and comfortable buying stocks.
I pay for 2 services that I read only sparodically but I read your blog every day. Looking at the GMI index for the last few months has made me convinced that with a market that has pulled back this far your first and second GMI indicator won’t go positive until we trade in the current range for another 4 to 6 months or the DOW starts to trade in the 10,000 range. There are just to many stocks which are deeply depressed to be making 100 52 week highs day after day. Of course with the market trading in this range the 200 day moving average wont’ turn positive for another 4 months either.
Frank Prevost
I agree that it will take a long time for the 30 week average to reverse up. The GMI is a combination of long and short term indicators and will not rise to 6 quickly. I use the GMI to guide me in my extra conservative university pension money. The GMI has to be very strong for me to go back into the market with that money. However, in my IRA trading account, I begin to enter the market when the indexes, especially QQQQ, are above their 10 week averages, like now.
Fine and dandy your comparison with 1932 data. But the past is not the key to the present nor to the future simply because the market dynamics are different today.
markeing ans seo at the brilliant seo specialists from gin house. [url=http://www.web-house.co.il]×§×™×“×•× ×תרי×[/url]