MY POST ON AUGUST 26
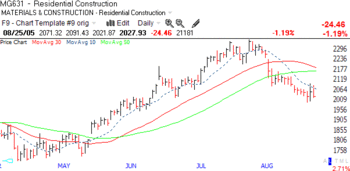
"I can’t count the number of times I have bought puts on the housing stocks only to find them turn up again.  But I think they may really be topping out now. Look at this chart of the residential construction sector. Note that the index is now below the 10 day, 30 day and 50 day averages. The 10 day (dotted line) is now consistently below the 30 (red) and 50 (green). This chart pattern is similar to a host of housing stocks such as: BZH, PHM, LEN, RYL, KBH, MDC, DHI, TOL, CTX, MPH, HOV, to name only a few. All of them have shown volume spikes recently on down days. Even TOL, a Cramer favorite, could not retain its gain on good news and reversed to close down near its daily low on Thursday on unusually large volume. This may only be a correction in housing, but it is consistent weakness among all of the leaders. Is the roof finally about to cave in?"
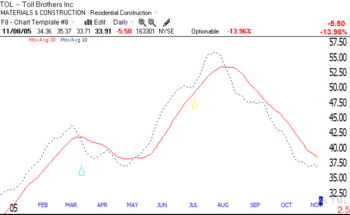
In this field of market analysis one must take credit for those few times one gets it right. Last August, it became clear to me that the housing stocks were all acting badly. And on Tuesday, the roof finally caved in with TOL’s almost 14% decline when it announced a slowdown in business. The beauty of technical analysis, and the weakness of relying on public business information, is that the chart shows the selling behavior of those in the know long before the bad news comes out. Shame on anyone who was holding TOL since August. Remember I showed you "naked charts," where the price is invisible, so the 10 and 30 day moving averages can be clearly seen? Look at this chart of TOL.  Last August the 10 day average (dotted line) declined below the 30 day average (red line) and a few days later the 30 day average curved down. Look how easy it was to see the change in trend. No one should have been caught in Tuesday’s huge decline. Perhaps we should have a rule only to buy/hold stocks when the 1o day average is above the 30 day average and both averages are rising……………………….
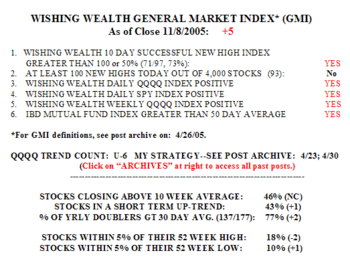
The GMI declined 1, to +5. This decline occurred because there were only 93 new highs on Tuesday.  All other indicators remained stable. Only 41% of the Nasdaq 100 stocks rose, 41% of the S&P 500 stocks, and 37% of the Dow 30 stocks. Tuesday was the sixth day in the QQQQ up-trend.
Please send me your feedback at: silentknight@wishingwealthblog.com.