GMI: 1+; GMI-R: 4+; My take on the market; some possible leaders

The GMI moved down from 2 to 1+ (of 6) and the GMI-R rose from 4 to 4+ (of 10).  Another up day in the SPY will make the Daily SPY Index turn positive. Gmi1130 The GMI-R is stronger than the GMI because it has a number of shorter term indicators that can detect a change in trend earlier.  The Worden T2108 Indicator is now at 29%, up from a low of 13% and well out of the area where declines tend to end.  Moreover, 63% of the 16 short term indicators for four indexes (DIA, QQQQ, SPY, IJR) that make up the GMI-S are now positive. On Friday the QQQQ completed the 15th day of its short term down-trend (D-15).
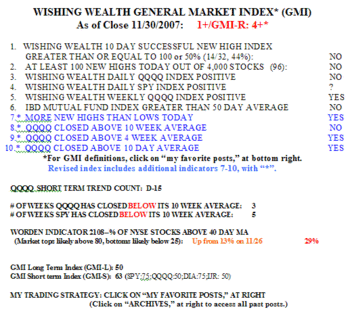
So where do I stand on the current market trend?  Evidence on the side of a possible end to the current decline in the QQQQ are: 1) MACD for the daily QQQQ has had a bullish cross of its signal line; 2) T2108 indicator is rising out of extreme lows; 3) GMI-R is 4+; GMI-S is now 63%; and 4) leading growth stocks  (AAPL, RIMM, ISRG, BIDU) are holding up.  On the side of a continuing decline are: 1) GMI is 1+, reflecting a small number of new highs, a weak daily QQQQ trend, a weak IBD growth mutual fund trend; 2) the QQQQ remains below its 10 week average; and 3) the QQQQ has just bounced down off of resistance at the 30 day average. To sum up, it looks like the most sensitive indicators are starting to turn up, but the relatively longer term trend indicators are still declining.  Statistically, this is how turnarounds must unfold.  The prudent thing to do is to wait a little longer to see whether the longer term indicators follow suit and start to rise. The jury is still out for me…..

If this rally has staying power, I should begin to look at stocks that might lead an up-trend.  My TC2007 scan yielded the following rocket stocks that might be among the leaders: MTL, TRA, CF, MOS, HMSY, GEOY, ATRO, MICC, SYNA, ISRG, WGOV.  All of these stocks have strong technical patterns plus recent quarterly earnings increases of at least 100% and revenue growth of 20+%.  Six of the eleven have appeared on one of the IBD100 lists I have followed during the past year. I will keep an eye on these stocks in case this up-trend continues.

See my disclaimers below.
GMI: 6; some rockets and submarine stocks

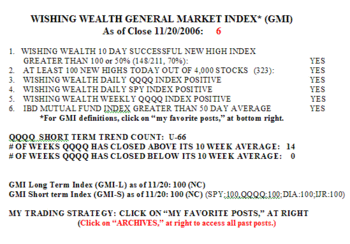
The GMI remains at 6.   Only 46% of the Nasdaq 100 stocks advanced on Monday along with 39% of the S&P 500 and 33% of the Dow 30 stocks.   Gmi1120_1 55% of the IBD 100 stocks from 10/20 advanced and 24 of them hit new highs.   Thus, the tech growth stocks outperformed most other stocks yesterday.   There were 323 new yearly highs in my universe of 4,000 stocks. Monday was the 66th day in the current QQQQ up-trend (U-66).

A TC2007 scan of the market detected 59 rocket stocks.   The 5 biggest gainers among them on Monday were: IAAC, SIM, GROW,CNS and KNOT.   The biggest losers among the 38 stocks that showed up in my submarine scan were: SIE, ADM, LMS, CMX and CVS.   MHS and WAG are two other drug store stocks that are diving submarines. The GMI is too strong, however, for me to go short these declining stocks.

GMI: 0; IBD100 performance; Cash balances earning 4.8%?

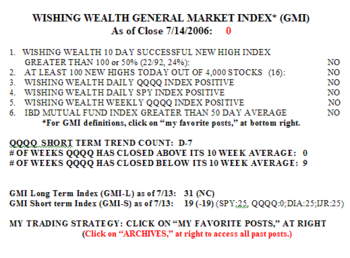
The GMI is still at zero.  There were 300 new lows and just 16 new highs on Friday.  The last time we had more than 300 new lows (324) in my universe of 4,000 stocks was October 12, at a near term bottom.  However, many of my indicators, while low, are not at extreme lows.  For example, 14% of the Nasdaq 100 stocks closed above their 30 day average, compared with 9% on June 13.  Gmi0714 The GMI-S is now at 19, reflecting weakness in almost all of my short term indicators for the four major stock indexes.  The GMI-L is only a little better, at 31. 21-27% of the stocks in the Nasdaq 100, S&P 500 and Dow 30 indexes advanced on Friday. Friday was the seventh day (D-7) in the current QQQQ down-trend and the ninth week that the QQQQ has closed below its 10 week average.  The IBD mutual fund index is below both its 50 day and 200 day moving averages and the 50 day is close to crossing below the 200 day.  Thus, the professional growth fund managers are suffering in this market, another indication to stay away from growth stocks now.

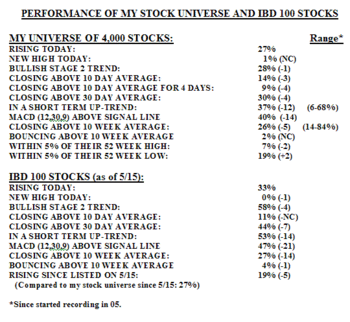
The IBD 100 stocks continue to be slaughtered.  Ibd0714 I think that the way IBD tracks  the performance of the IBD 100 is very misleading because they keep replacing underperforming stocks with better performing stocks.  When you look at the performance of the IBD 100 list published on a  particular date (5/15) we get a more accurate indication of how these types of stocks have performed.  Since 5/15, only 19% of the IBD 100 stocks have advanced, compared with 27% of the 4,000 stocks in my universe.  Only 26-27% of the stocks in each group closed above their 10 week averages.  None of the IBD 100 stocks and less than 1% of my universe of stocks hit a new high on Friday.  Need any more evidence that growth stocks have been a dismal investment since mid-May?

I am  100% in cash now, given my coming vacation.  Since mid-May it has  been almost too easy to trade profitably on the short side.  Buying deep in the money puts in my IRA has been a wonderful strategy for this market.  I urge all readers to get a copy of O’Neil’s book on shorting and to study the charts.  A current scan of the market using TC2005 yields 7 rocket stocks and 422 submarines.  Riding submarines down or staying in cash has been the best way for me to ride out the current market.  With Fidelity Cash Reserves paying me about 4.8% for the cash balance in my account, it is nice to be on the sidelines.  What is your brokerage firm paying you for your cash balances? You may be surprised/disappointed……….

Please send your comments to:  silentknight@wishingwealthblog.com.