This week should reveal whether this short term decline 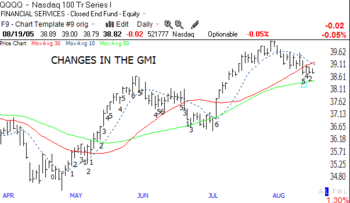 deepens, or terminates. The main indexes I follow are sandwiched in between their 30 and 50 day averages, and resting just above their 50 day averages. Note from this chart that the QQQQ has closed below its 10 day average (dotted line) for the last 11 days. The QQQQ has also closed below its 30 day average (red line) for the past 4 days and the 10 day is crossing below the 30 day. Note that during the past 4 days the QQQQ has closed between the red line (30 day) and the green line (50 day). The prior decline ended at the end of June when the QQQQ held its 50 day average. Will it hold again?
The chart above also shows the changes in the GMI (click on chart to enlarge). The GMI is now +2, but the IBD Growth Mutual Fund Indicator is very close to turning negative, demonstrating that even the growth fund pros are having trouble making money. This is a bad omen. 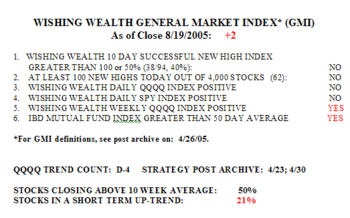 There were also only 38 successful 10 day new highs and only 62 new yearly highs Friday, in my universe of 4,000 stocks. Only 35% of the Nasdaq 100 stocks rose Friday, along with 55% of the S&P 500 and 40% of the Dow 30 stocks. We are now in the fourth day (D-4) of the decline in the QQQQ.
The WPM reveals the depth of the weakness in the short term indicators.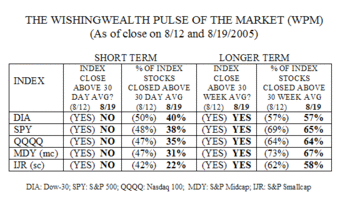 Compared to the week ending on 8/12, all 5 indexes now trade below their 30 day averages. Furthermore, there have been considerable declines in the percentage of their component stocks that closed above their 30 day averages. The biggest decline occurred in the small cap stocks– only 22% of them closed above their 30 day averages, compared with 42% a week earlier. A large decline also occurred in mid cap stocks (31% vs. 47%), although the remaining 3 indicators also showed declines. In contrast, the longer term indicators hardly budged, demonstrating that the market is till in a general up-trend.
So, what do I discern from the above? The short term trader should probably be in cash or short. Since August 2 when the QQQQ peaked, this Nasdaq 100 ETF has fallen 3.19%, and 73% of its 100 component stocks have declined–36% of these stocks declined more than 5%. Why fight these odds? This is also not the time to buy stocks breaking to new highs. The longer term trader who tends to stay in stocks for months probably can retain positions for now, with the protection of defensive stop losses. It remains to be seen whether this short term weakness will turn into a major decline. Such a development would be evident to me if the GMI goes to zero. As for me, my IRA is currently 90% in cash with my remaining funds in September and October puts. Housing, autos and mortgage securities are in downtrends, for now. I always become more cautious during the September/October period. Have a great week.
Please send me your feedback at: silentknight@wishingwealthblog.com.
