The GMI remains at +5, with only the Daily QQQQ Index still negative. There were 243 yearly highs 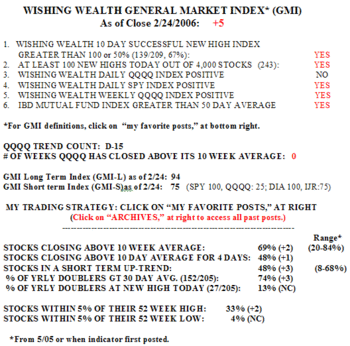 in my universe of 4,000 stocks and 139 successful 10 day new highs (stocks that hit a new high ten days ago and that closed higher on Friday than they did 10 days earlier). 69% of stocks closed above their 10 week averages and 48% are in a short term up trend. A full one third of stocks are within 5% of their 52 week highs. 60% of the Nasdaq 100 stocks rose on Friday, along with 56% of the S&P 500 stocks and 53% of the Dow 30 stocks. Friday was the fifteenth day in the QQQQ short term down trend (D-15). But the MACD is very close to reversing, suggesting underlying strength in this index.
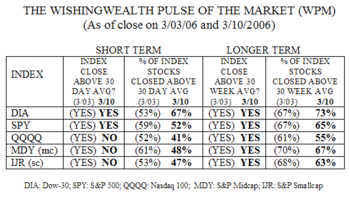
The WPM shows the weak performance of the Nasdaq 100 stocks relative to the other four indexes. 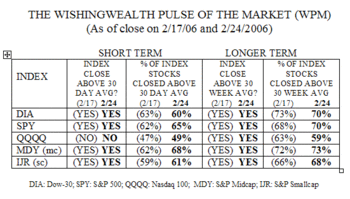 Only the QQQQ closed below its 30 day average and only 49% of its component stocks closed above their 30 day averages. In contrast, 60-68% of the components of the other four indexes closed above their 30 day averages. All five indexes closed above their longer term 30 week averages and almost 70% of the components of all indexes but the Nasdaq 100 (59%) closed above their 30 week averages. The midcap stocks appear to be most likely to be in short and long term up trends……..
The reluctance of the pundits to accept the recent up trends in most of the indexes is striking and makes me think that this is the rally that people love to hate. Four of the five indexes reviewed above are in short term up trends and very close to their yearly highs. And even the Nasdaq 100 remains in a longer term up trend with the rest of the indexes. So why has the sentiment of investment newsletters become more bearish in the past few weeks? According to IBD, the Investors Intelligence reading is now 45.3% bullish and 29.5% bearish. In contrast, more than 60% were bullish in early January when this rally began and only about 20% were bearish. Do the newsletter writers actually become less bullish as the market rises? I thought sentiment was typically a contrary indicator with people being most bullish at the top, after a rise. Furthermore, the NYSE advance/decline line keeps hitting recovery highs and the put/call ratio is a relatively high .76. Maybe everyone is just spooked by the semi-inverted yield curve and the threat of terrorism and behave as if the economy and the market must swoon. I just hate to denigrate this market when there appears to be so much agreement that it must decline–even in the face of the considerable technical evidence to the contrary……….
Please send your comments to: silentknight@wishingwealthblog.com.
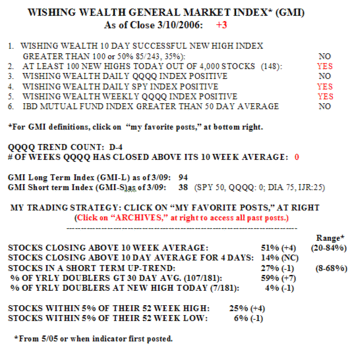
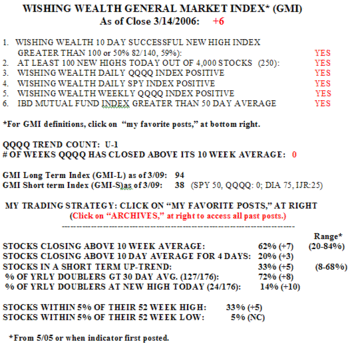 There were 250 new 52 week highs and 62% of stocks closed above their 10 week averages. 33% of the 4,000 stocks in my universe are now in a short term up trend and 33% are within 5% of a new high. Between 83-88% of the stocks in the Nasdaq 100, S&P 500 and Dow 30 indexes climbed on Tuesday. Tuesday was the first day in the new short term up trend in the QQQQ……..