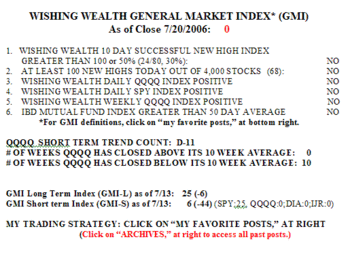
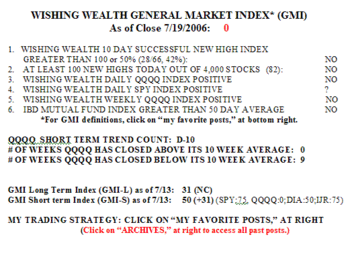
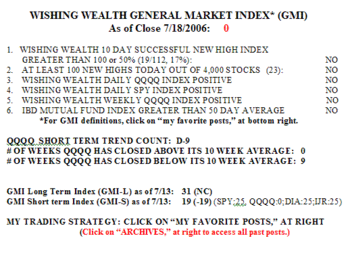
While the GMI has been zero for some time, note that the GMI-L is now 25 and the GMI-S is 6. This means that all but one of the 16 short term indicators for the four major indexes are negative; and now the long term indexes are weakening.  12% of the Nasdaq 100 stocks rose on Thursday along with 21% of the S&P 500 stocks and 27% of the Dow 30 stocks. While 18% of my universe of 4,000 stocks rose, only 6% of the IBD 100 stocks from 5/15 rose. The market is slaughtering tech and growth stocks. Only 50% of the IBD 100 stocks from 5/15 are in a bullish stage 2 up-trend, the lowest percentage since I began tracking this indicator on June 9 (range: 50-81%). Only 32% of these IBD 100 stocks from 5/15 closed above their 30 day averages. The QQQQ is in its eleventh day (D-11) of the current short term down-trend and has closed below its 10 week average for 10 straight weeks.
So what to do? I am going on vacation, but will try to update the GMI sometime between now and early August when I return. Every successful trading guru I respect has written that there are times to be out of the market. The eloquent Jesse Livermore said there were times to go short, go long, and to go fishing. Nicolas Darvas said only to trade when one’s conditions for trading are perfectly met by the market. The "M" in CAN SLIM says to stay out of growth stocks when the general market is declining. There is no hurry or urgency to trade. With the market acting so schizoid, I am going fishing. The saying, "in May go away," has never been more appropriate. Check out Thursday’s Investor Education myth buster article in IBD for an analysis of why it makes sense to be out of the market during declines. Perhaps the market will give us a better opening in the fall. Conservation of capital keeps one in the game…….
Please send your comments to: silentknight@wishingwealthblog.com.

