GMI: 6; Window dressing over; October surprise?

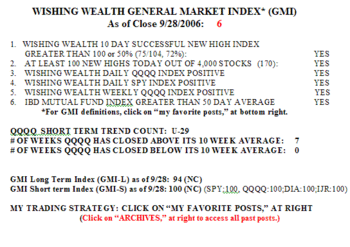
The GMI held at +6 and window dressing will come to an end on Friday.  Between 53-61% of the stocks in the Nasdaq 100, S&P 500 and Dow 30 indexes rose on Thursday.  Gmi0928 There were 170 new highs in my universe of 4,000 stocks.  72% of the stocks that hit a new high 10 days ago closed higher on Thursday than they closed 10 days earlier.  Thus, buying new highs has likely to have been a profitable strategy. The QQQQ is in its 29th day of an up-trend and has closed above its 10 week average for 7 consecutive weeks.  When the QQQQ remains above its rising 10 week average, I typically make money trading on the long side. Since the beginning of the QQQQ up-trend in mid-August, that index has risen 8.3% and 81% of the Nasdaq 100 stocks have advanced; 38% of the stocks are up 10% or more.  Riding with the market trend has produced splendid odds of making a profit.  In comparison, only 51% of the IBD 100 stocks posted on 5/15 have advanced during the same period…
We are now approaching the terrible month of October when many large declines have occurred and important bottoms have been put in.  I have often times gone to cash in October and bought back in in early November.  Studies have shown that the period from November through April contains a disproportionate amount of market gains.  But everyone is so smart now and expects an October decline first, before we get the end of year strength.  With the GMI indicators so strong, this might be the time that October fools the masses.  I would not be surprised to see an early sharp decline followed by a strong rebound that leaves many skeptics behind.

Please send your comments to:  silentknight@wishingwealthblog.com.
GMI: 6; IBD Meet-up not bullish; IBD 100 new highs

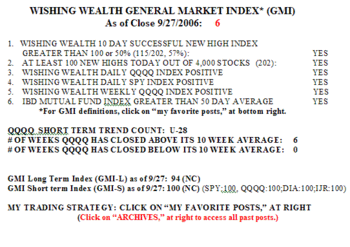
The GMI remains at 6, but the QQQQ was the weakest index Wednesday.  53% of the Dow 30 stocks advanced along with 46% of the S&P 500 stocks but only 38% of the Nasdaq 100 stocks.  Gmi0927 But there were 202 new highs in my universe of 4,000 stocks and Wednesday was the 28th day of the current QQQQ up-trend.  Only 44% (4/9) of my IBD meet-up members were optimistic tonight about the next few months, suggesting to me that this market will be higher come November.  66%of the IBD 100 stocks from 5/16 and 75% of the IBD 100 list from 8/14 closed higher on Wednesday, suggesting that IBD type growth stocks were stronger on Wednesday.  Seven stocks from the list on 8/14 hit new highs:  FMD, TNL, NITE, GYMB, TWGP, GILD and CTSH.  Some of these stocks might lead a year end up-trend…

Please send your comments to:  silentknight@wishingwealthblog.com.
GMI: 6; Nasdaq 100 stocks outperform IBD 100 stocks; Nibbling at GOOG?

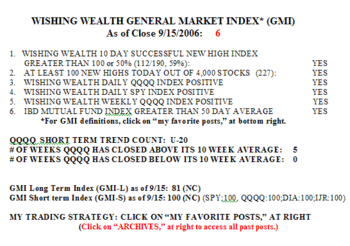
The GMI has been 6 for the past four sessions.  Gmi0915 51-60% of the stocks in the Nasdaq 100, S&P 500 and Dow 30 indexes rose on Friday.  There were 227 new yearly highs in my universe of 4,000 stocks.  In addition, there were 112 successful 10 day new highs, indicating that buying new highs has likely to have been profitable.  Friday was the 20th day in the current QQQQ up-trend.  81% of the Nasdaq 100 stocks closed above their 30 day average, compared with 71% of my stock universe.  Thus, tech stocks are a little stronger.

Nevertheless, the performance of the IBD 100 stock lists has been spotty.  Only 23% of the stocks on the list published on 5/15 closed higher on Friday than they closed on 5/15.  Furthermore, only 49% of the stocks on the list published on 8/14 have closed higher.  Thus, the majority of the IBD 100 stocks have closed lower since they closed on the lists published on these dates.   The IBD 100 stock index performance published by IBD is heavily biased upward by the fact that each week they delete from the index (and its computation) as many as 20% of the worst performing stocks.  (Why compute such an unstable index?) In comparison, on Friday, 89% of the Nasdaq 100 stocks closed higher on Friday than on 8/14.  So the Nasdaq 100 stocks are vastly outperforming the IBD 100 stocks????!!!!!

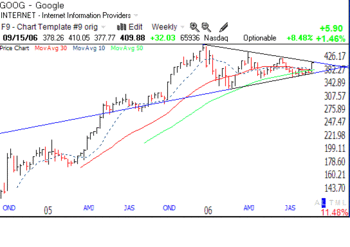
I am looking at GOOG as a possible buy.  Technically and fundamentally GOOG looks very interesting to me.  A few weeks ago it looked like GOOG was ready to decline.  Its 30 week average (red line) appeared to be reversing down.  But last week the stock showed signs of life with a rise above its 30 week average on increased volume.   Goog0915 The stock closed near its weekly high and right up against its descending trendline.  The fundamentals aren’t shabby either, last quarterly earnings +98% and a PE ratio of only 55.  Maybe GOOG’s chart  is revealing buying by insiders and institutions who expect more good earnings from this giant on October 19.  If this tech rally lasts, GOOG could have a huge move, given this consolidation that dates back to the beginning of this year.  I just might nibble at this stock if it can break through this trendline…….

Please send your comments to:  silentknight@wishingwealthblog.com.