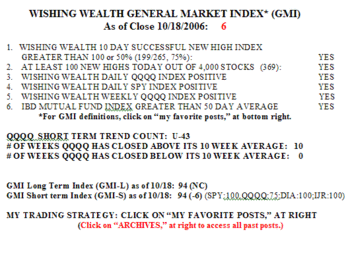
The GMI remains at 6, but the GMI-S fell 6, to 94.  This decline reflects the weakness in one of the short term indicators for the QQQQ. Only 44% of the Nasdaq 100 stocks advanced on Tuesday, compared with 56% of the S&P 500 stocks and 50% of the Dow 30 stocks. 46% of the IBD 100 list from 10/16 advanced. There were 369 new yearly highs in my universe of 4,000 stocks. Tuesday was the 43rd day in the current QQQQ up-trend and the 10th week that it has closed above its 10 week average.
IBD
GMI: 6; Cramer right?
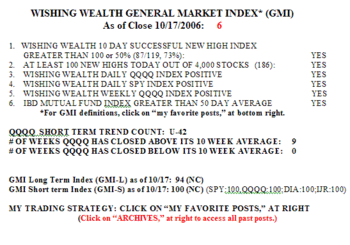
The GMI is still 6, but few stocks rose on Tuesday. Only 14% of the Nasdaq 100 stocks rose, along with 32% of the S&P 500 and 40% of the Dow 30 stocks. Only 20% of the IBD 100 stocks from 10/16 rose. Tuesday was the 42nd day of the current QQQQ up-trend.  Cramer may have again signaled the short term top with his bullish comments on the Today Show last week….
GMI: 6; IBD100 stocks outperform Nasdaq 100 stocks
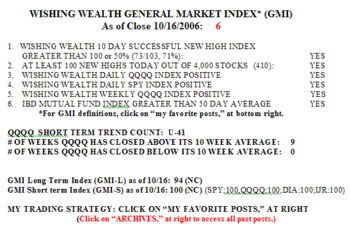
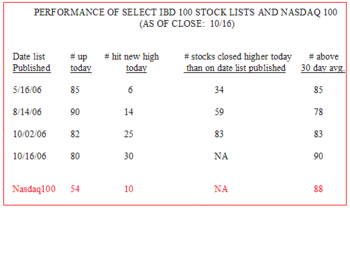
The GMI is still 6 and there were 410 new highs in my unive rse of 4,000 stocks on Monday. 54% of the Nasdaq 100 stocks advanced, along with 65% of the S&P 500 stocks and 57% of the Dow 30 stocks. Monday was the 41st day in the current QQQQ up-trend. What was striking Monday was the stronger performance of the IBD 100 stocks, compared with the Nasdaq 100 stocks. 80%-90% of the stocks in four recent IBD 100 lists advanced, compared with only 54% of the Nasdaq 100 stocks.
  Three of the four IBD 100 lists had more new highs on Monday than the Nasdaq 100 stocks. These differences suggest to me that the market leadership is moving towards stocks with great fundamentals and technical action, as defined by IBD. ….