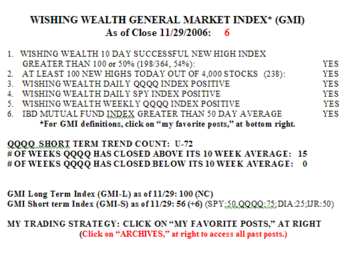
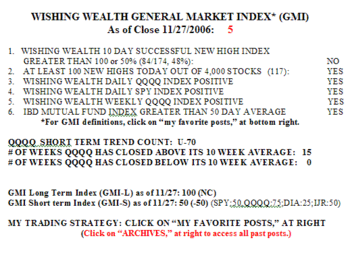
The GMI is still 6. But only 25-35% of the stocks in the Nasdaq 100, S&P 500 and Dow 30 indexes rose on Friday. 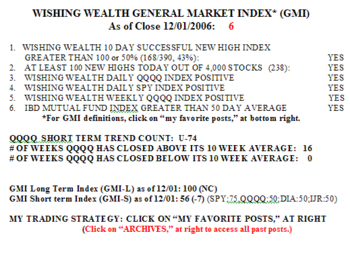 There were 238 new 52 week highs in my universe of 4,000 stocks. Friday was the 74th day of the current QQQQ up-trend. While the GMI remains at 6, I am concerned by the weakening in the GMI-S indicators. For the first time since this up-trend began, the QQQQ has closed 5 consecutive days below its 10 day average, which itself is curving down. The leaders are also weakening. GOOG closed below its 30 day average for the first time since last August. (I had already sold my GOOG.) AAPL has also stalled for now, although it remains in an up-trend. I therefore lightened up a little on the QLD and bought some QID. I am hedged a little on the direction of the QQQQ and will wait to see which trend unfolds.
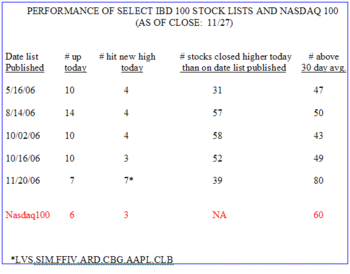
The IBD 100 stocks have been 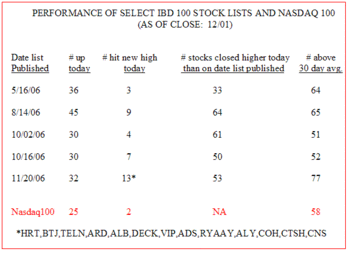 holding up okay. The best list in this table, the one from 11/20, had 13 new highs on Friday, compared with the Nasdaq 100 stocks that had only 2 new highs. Note, however, that only 53% of the IBD 100 stocks from 11/20 closed higher on Friday than they did on 11/20. Still, 77% closed above their average price for the past 30 days, compared with 58% of the Nasdaq 100 stocks.
