The GMI fell to 5 and the GMI-S fell 19, to 44. 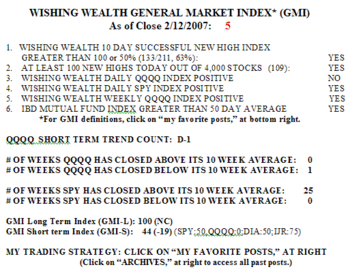 26% of the Nasdaq 100 stocks rose on Monday, along with 37% of the S&P 500 and 43% of the Dow 30 stocks. There were only 109 new highs in my universe of 4,000 stocks. The GMI-S fell to 44, as none of the four short term indicators for the QQQQ remain positive. Monday was the first day in the new QQQQ down-trend, but the moving averages are flat, indicating no strong up or down-trend. The QQQQ remains within its horizontal channel. Only 41 of the stocks from the IBD 100 list from 2/05 rose on Monday and only 46% closed above their price on 2/05. Only 51% of the Nasdaq 100 stocks closed above their 30 day averages.
Please note my disclaimers at the bottom of yesterday’s post.
