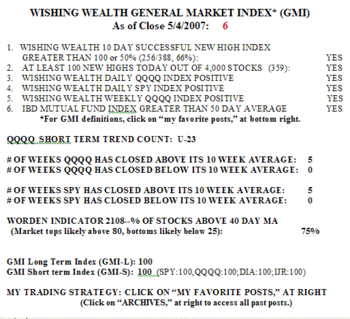
The GMI is still at the maximum of 6. The Worden T2108 indicator, the percentage of stocks above their 40 day moving average, is now back to 56%, up from a bottom reading of 34% at the end of June. The pendulum is swinging back and typically does not top out until around 80%. So this rally probably has more to go. So many stocks appear to be strong and the Nasdaq 100 tech stocks are leading the market up.
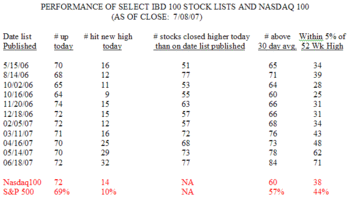
Speaking of growth stocks, take a look at how the IBD 100 stocks have been doing. You will recall that IBD’s continual substitution of good performers in the list for poor performers biases the performance of the IBD 100 index over time. My table below shows how each each original list has performed after it was published in IBD.  Note that only about 50-60% of the stocks in the lists from 2006 closed on Friday above their price when the lists were first published. I added a new column to the table, the percentage of stocks in each list that closed on Friday within 5% of their 52 week highs. Note that the majority of the IBD 100 stocks on the lists from only the last two months, May and June, are within 5% of their yearly highs. 62% of the stocks on the IBD 100 list published on May 14 and 71% on the list from June 18, closed within 5% of their 52 week highs. In contrast, only about one third or less of the stocks on the lists from February 5 and before, are near their yearly highs. Another noteworthy finding from the table is the number of new highs last week among the IBD 100 stocks. Approximately one fourth to one third of the stocks on the lists from April, May and June hit new highs last Friday, compared with only 10-14% of the Nasdaq 100 or S&P 500 stocks. These statistics suggest to me that one should not marry the IBD 100 stocks, but stay mainly with those on the more recent lists published by IBD.
I am a little cautious about this market because many traders have told me they are making money. It is unfortunate that one only realizes that the market trend has changed, sometime after it has occurred. Enjoy this uptrend, but we must be prepared to lose some of our profits after it ends….


