The GMI is still 3 (of 6) but the GMI-R fell one, to 6 (of 10). This is because there were only 27 new highs and 28 new lows in my universe of 4,000 stocks on Wednesday. The indicators in the GMI have kept me out of all major market declines since 1995, including the bad markets of 2001-2002. I then got back in the market in 2003 and my account was up over 50% that year. I also avoided the decline that began last January, which lasted 55 days. The new QQQQ short term up-trend is in its second day and I am beginning to wade into this market slowly by buying QLD and writing some covered calls. If this up-trend should end quickly, I will get out and go immediately to cash again. There is always time to catch a real up-trend that can last months…….
The service that I use to scan stocks for writing covered calls is at www.poweropt.com. I like this service because I can narrow down my scan to include only IBD100 stocks. The IBD100 stocks include the strongest stocks based on fundamentals and technical action as assessed by IBD. I also eliminate stocks that will report earnings during the option period. I was burned several times by writing covered calls on stocks that announced earnings and then plunged. In a market up-trend writing calls on growth stocks with large premiums is the easiest and least stressful way I have ever made money in the market. Joseph Hooper’s book educated me about this new way to look at writing covered calls for income. While I do not follow his method of stocks selection and technical analysis, I do like his philosophy of writing near month covered calls for 3-5% income each month. I do all of this trading in my IRA and do not have to worry about taxes. Check it out…
My friend Judy, who is the best stock picker I have met, buys stocks based on concepts long before the technical action meets my requirements. 
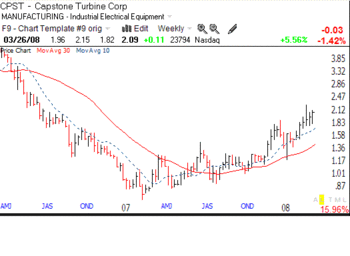
When she told me about this stock that she bought for about $1 per share, I told her I do not buy cheapies. But the stock has been rising, so I bought some around $2.09. CPST makes microturbine engines and appears to be getting a lot of contracts. If Judy likes a concept, it is good enough for me–as long as the chart looks good. This weekly chart shows that CPST is now holding well above its rising 10 week average (dotted line), which in turn is above its rising 30 week average (red line). As long as the stock holds above this dotted line, now at 1.73, I will hold the stock. This is not a recommendation, just an example of the chart pattern I look for and how I limit my risk. By the way, most recent volume spikes are occurring on up weeks, suggesting strong buying. So, again, Judy buys at a price much lower than I do…


