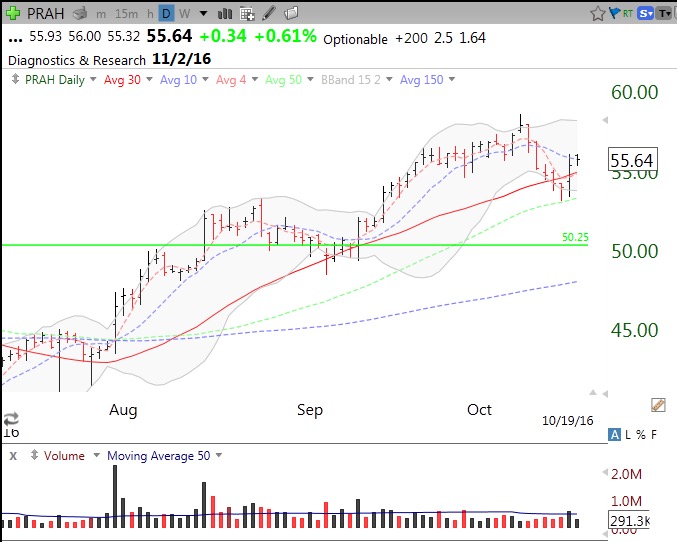
PRAH bounced off of lower Bollinger Band and 30 day and 50 day averages. A few weeks ago it broke out to an all-time high. Must hold 53 or bounce will have failed. IBD comp rating: 96
Stock Market Technical Indicators & Analysis
PRAH bounced off of lower Bollinger Band and 30 day and 50 day averages. A few weeks ago it broke out to an all-time high. Must hold 53 or bounce will have failed. IBD comp rating: 96
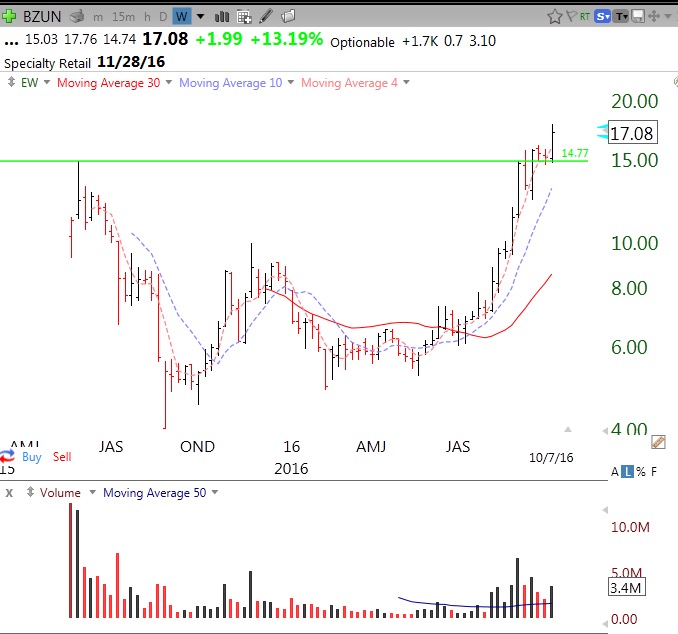
This weekly chart shows that BZUN had a high volume GLB break-out on Friday to an all-time high. BZUN has a 99 RS rating on IBD. BZUN has more than tripled over the past 250 days.
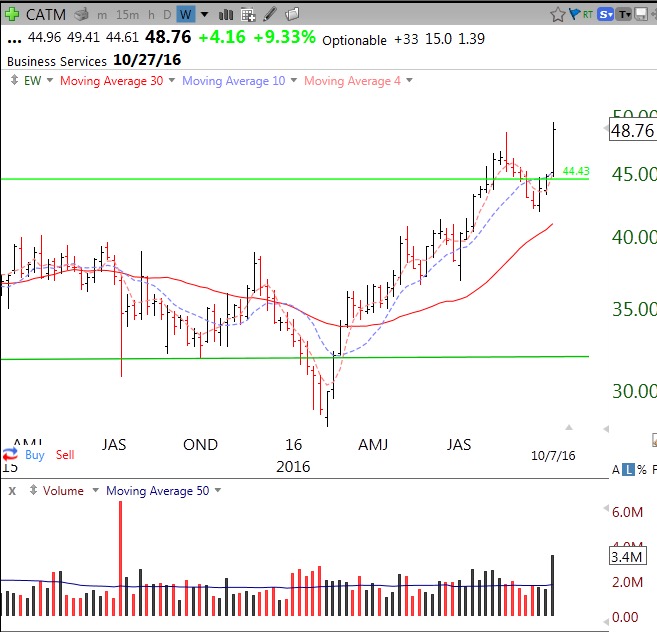
CATM also broke out last week. CATM has an IBD Composite rating of 93.
I attended the free TC2000 work-shop in Virginia on Saturday. The new Version 16 of TC2000 allows trading from charts and includes options. It also allows one to paper trade right off the charts so as to test out various signals and strategies. I was amazed by what is now possible with this powerful software. Check it out!
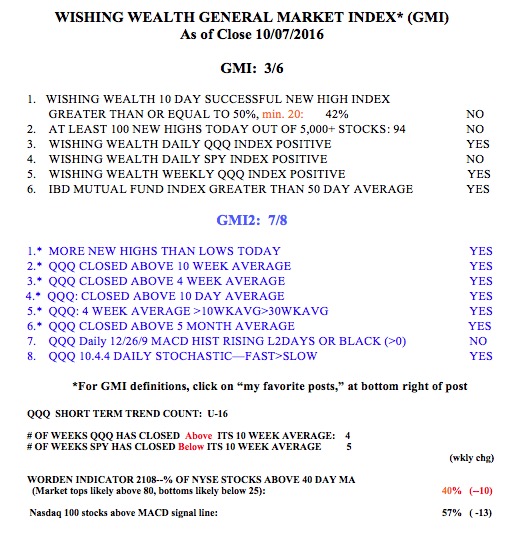
The GMI is now 3, but it is still on a Green signal.
The market is showing a strange split similar to the one that occurred in early 2008 when the SPY showed a lot more weakness than the QQQ. This is because the financial stocks in the SPY were cratering while the Nasdaq 100 index, which has no financial stocks, held up better. We are faced with a similar market. The DIA and SPY are below their 10 week averages but the QQQ remains above its 10 week average. This divergence will end with the SPY and DIA joining the QQQ in a renewed up-trend, or in the QQQ joining their down-trend. By my count, the QQQ reached the 22nd day of the current short term up-trend on Friday. Another show of strength is that some important market leaders, GOOG, AAPL, CMG, BIDU, and PCLN, remain in up-trends. When good earnings can propel a growth stock like GMCR up 16% on Thursday, it does not look like the market is entering a period of bearishness. I may be completely wrong, but this market looks to me like it has a lot of underlying strength, at least for growth stocks. 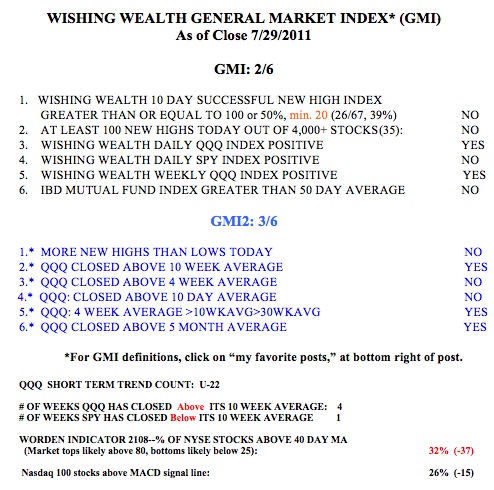
So, even though the GMI is now at 2 (reflecting only the strength in the QQQ) and IBD considers the market to be in a correction, I am staying with some long positions in the leading growth stocks and in QLD. However, a few more days of weakness could cause me to sell out, if a new QQQ short term down-trend begins. The gridlock in raising the debt limit is scary stuff, but I rely mainly on the market’s behavior, rather than politics to guide my trading decisions. While the SPY and DIA are now below their 30 week averages, these averages are still rising and not even close to a Weinstein Stage 4 decline.
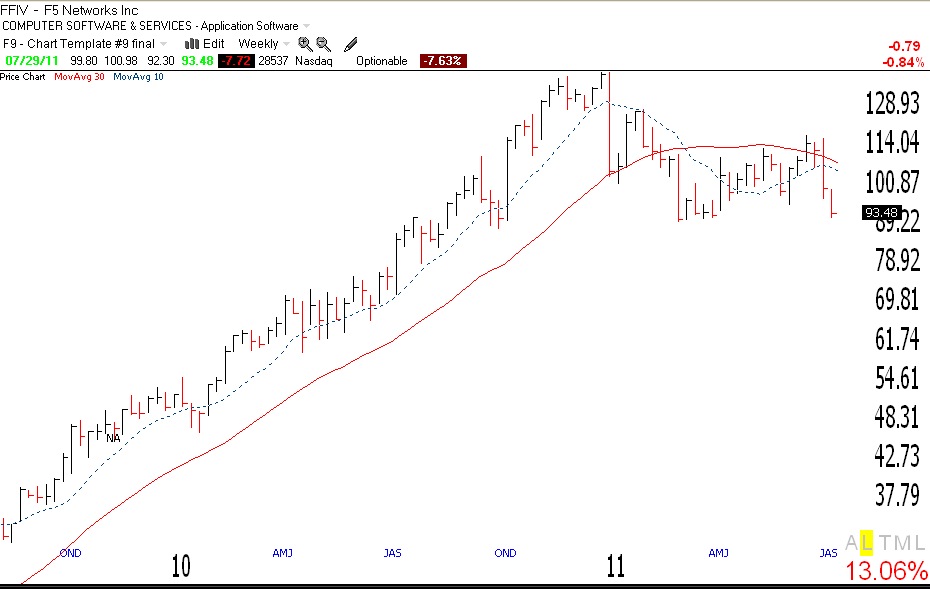
Speaking of Stage 4 declines, I have been watching FFIV for months trying to find a good place to short it. The developing Stage 4 pattern is just too perfect for me to ignore. (I do own a put on FFIV now.) After breaking out in April 2009 around $25, FFIV steadily climbed until it topped around $145 in January, 2011. In late January it had a huge volume down week, with far greater weekly volume than any since the up-trend began. It had another large volume decline in March and then began a rebound that ended in early July. Note that the 30 week average (red line) is now curving down, and the 10 week average (blue dotted line) is below the 30 week average. This stock looks very sick to me and I bought a longer term put option that will give FFIV time to decline. If the market continues to weaken, I think this stock will decline a lot. Remember, the bad news tends to come out after a stock’s turn, so I do not look to company news in order to decide whether to short a stock. (Click on this weekly chart to enlarge.) It should not take an experienced technician to see that FFIV’s up-trend has ended and a classic Stage 4 decline has likely begun. I believe FFIV is also showing the ideal shorting pattern that William O’Neil describes in his excellent book on shorting stocks ( book is listed at lower right of this post). On a daily chart, FFIV is very oversold and may be due for a counter-trend bounce within the longer term down-trend.