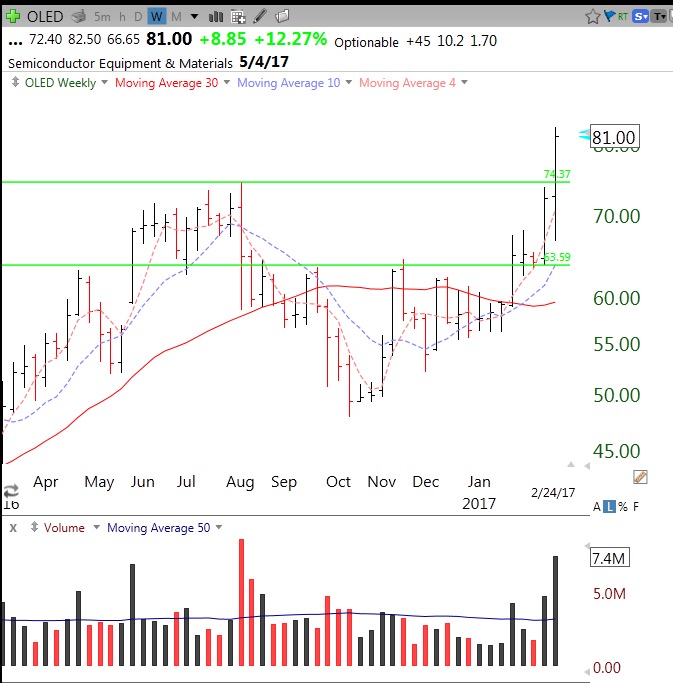
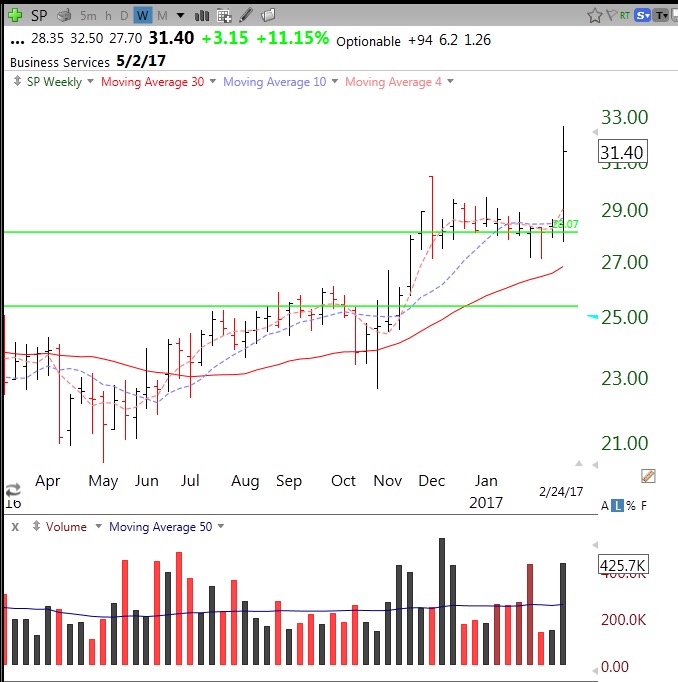
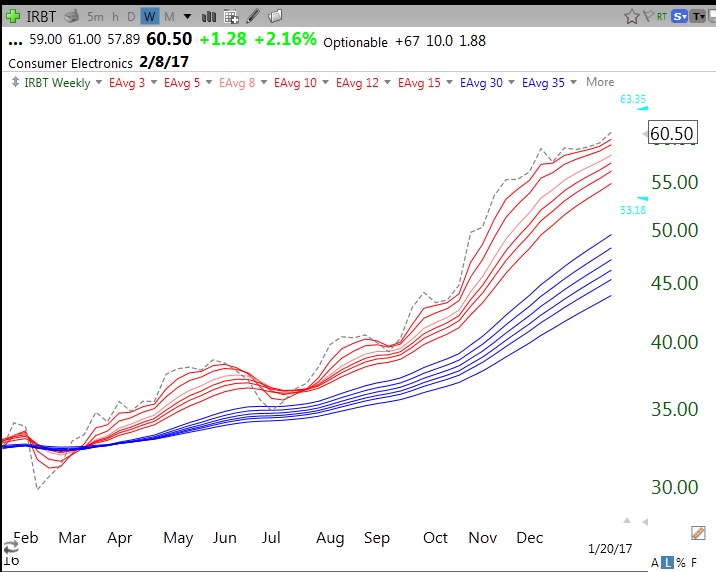
I spent some time this weekend entering descriptive information about my WatchLists and scans in the glossary from this blog. Those of you who have TC2000 can join my Club and access several WatchLists and EasyScans that I have published (access my club in your library tab). For example, I have a WatchList called Alltimehighs. You can now access this WatchList to monitor or run some of the scans I have developed that search this list for promising stocks. My Darvas scan, described in the glossary , identified 53 stocks this weekend. One of these, IRBT looks interesting to me. It had a GLB to an all time high in late October, then rose to around $60. It then entered a 5 week consolidation. IRBT showed signs of renewed strength last week. IRBT reports earnings on 2/8. I have a small position.
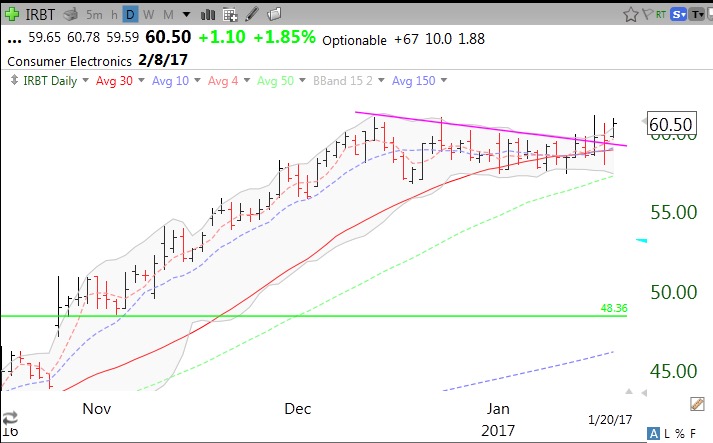
IRBT has a maximum RWBCount of 12 (of 12). All of the weekly moving averages line up properly.
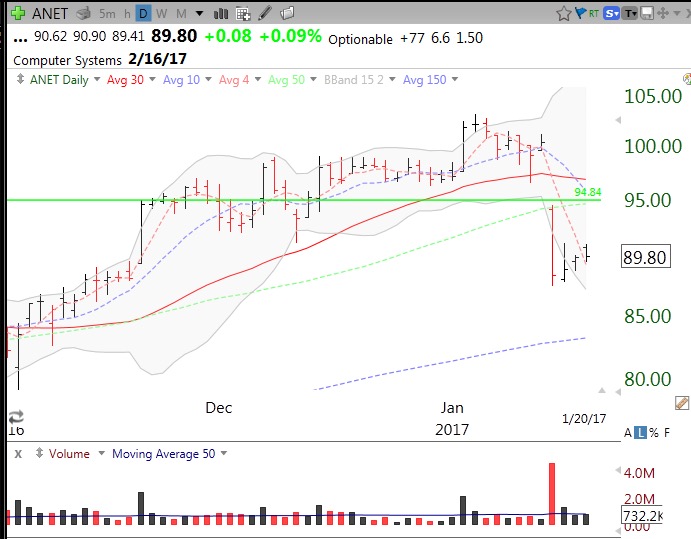
In early January, I tweeted intraday that a recent GLB stock, ANET, looked like it was moving up on above average volume. Seven days afterwards ANET gapped down on huge volume on some bad legal news. I saw no technical indicator that warned me in advance about this significant decline except for the fact that the stock traded back below its 30 day average (red line) a few days later, but it bounced. Also, the fact that the rise I wrote about only lasted for another day and the Bollinger Band expansion failed to continue were other signs of possible weakness. Technical signals can give me an edge, but they are not perfect. That is why I take small initial positions and only add to them if they prove themselves. If I owned ANET I would not sell now unless it fails to hold the recent support it had below its lower Bollinger Band, around 87.50.
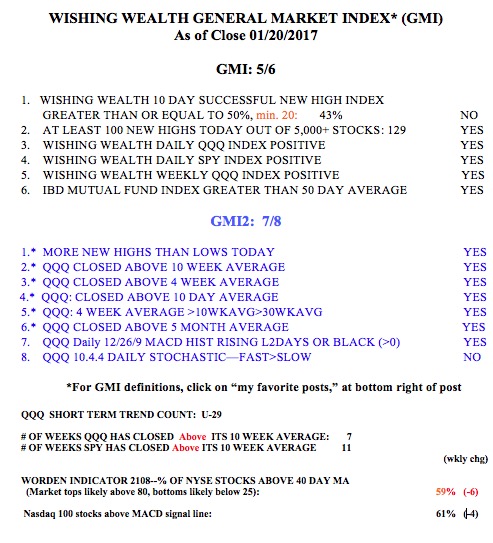
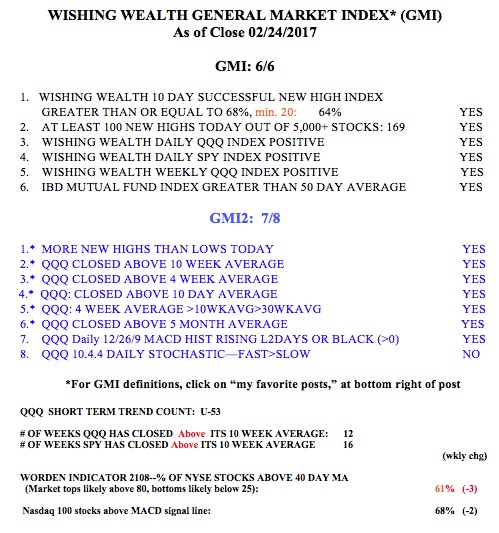
The GMI remains at 5 (of 6) and on a Green signal. The QQQ short term up-trend has now lasted 29 days (U-29).
