The trend is our friend; GMI: +3; Interest rates rising; a short list of stocks

To my visitors: I am only one trader, not a guru, and not a financial advisor.  I am presenting my own opinions and my own experiences and people are welcome to decide for themselves what, if anything, on this site is of value to them.  Please refer to the additional comments, highlighted in red, at the end of this post.

You may ask, why do I continually talk about the GMI?  It is because the majority of stocks follow the trend of the general market averages.  It is exemplified by the "M" in CANSLIM.  It is said that about 70% of stocks follow the market trend. If this is true, then why not trade with the odds in our favor?  This is one of the hardest lessons to learn.  In the past, I would lose all of my hard earned trading profits and more, when I kept buying break-out stocks in the inevitable decline that followed a bull move.  According to my analyses, the QQQQ is in day 6 (D-6) of a decline.  Using the TC2005 technical analysis program, I can count how many of the Nasdaq 100 stocks rose over the past 6 days– 38%.  Thus, if I bought a Nasdaq 100 stock on 6/24 and held it through Friday, 7/1, I had a 38/100 chance of having a profitable position.  On the other hand, if I had shorted a stock on 6/24, I had a 62% chance of having a winner.  As they say, the trend is our friend……………………………..

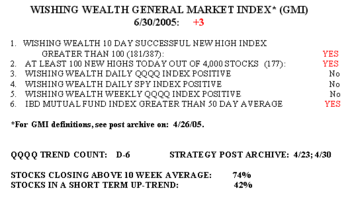
The GMI closed Friday at +3. 701gmi  The Spy and QQQQ indicators continue to be weak. IBD still maintains that the market is in a "confirmed rally."  And S&P thinks we are in for a great second half of the year.  I am not so sure.  I added a new indicator to the GMI box, Stocks in a Short Term Up-trend.  This indicator shows that 42% of the 4,000 stocks in my universe are in an up-trend, down from 55% when this decline began.  Furthermore, only 39% of the Nasdaq 100 stocks rose on Friday, compared to 63% of the S&P 500 stocks and 67% of the Dow 30.  The Dow 30 stocks look terrible to me with the following 20 stocks in a down trend:  UTX, INTC, MO, CAT, JNJ, PG, C, AXP, GE, MSFT, HD, DIS, KO, VZ, MMM, MCD, PFE, DD, AA, MRK.  Get the picture?  Two thirds of the Dow 30 stocks look technically weak to me.  It never fails to amaze me how these market analysts presume to predict the direction of stocks based on their interpretations of the economy.  Don’t they understand that the market always predicts the economy.  We typically find out the economic reasons for a market decline or a rise after it has occurred.  Maybe I should buy puts on the Dow ETF–DIA………………………………………….
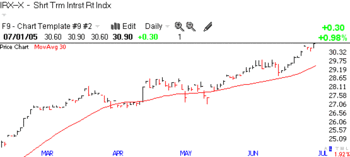
It is also curious to me how the pundits cling to a bullish scenario in the face of an aggressive Fed.  I think that it is well known that the market has an up-hill battle when rates are rising (Marty Zweig was a master at using Fed actions to time the market) and there is no ambiguity here. Irx701  The short term interest rate indicator has hit yet another new high.  It looks to me like the Fed will  over-tighten, yet again, and push the economy off the cliff.  Even if they don’t, rising oil prices and heating bills may kill the economy next winter.  When we read all of their market predictions, we must remember that market pundits tend to be overly optimistic–they need someone to buy their stocks from them.  It is rare that a commentator will advise the public to go to cash or to take the short side.  The wise speculators trade both sides of the market and embrace a trend, regardless of its direction.  Don’t take my word for it–read the classics listed on the right………………………………………….
I told you before that I have been successful in avoiding the bulk of market declines since 1998.  I exited the market completely in October, 2000 and got back in after it bottomed.  So, now I sit in cash or short and wait for the trend to develop.  If I am wrong about this decline, I can always reverse direction in an instant.  There is plenty of time to climb aboard a rising market if it is a  sustained multi-month uptrend–the only kind in which I can make big money………………………………..

I am beginning to look for stocks to short.  I ran a scan of the market to find stocks in consistent declines (falling rockets).  One industry that came up a lot was steel and iron mining stocks:  TONS, ROCK, WPSC, AKS, GNA, RESC, CGA.  Another sector that came up often was Telecom services-foreign:  DT, KPN, PT, TCP, SCM, CTC.  Should I add them to my short list?

Happy July 4th holiday to all.

Send your feedback and questions to: silentknight@wishingwealthblog.com.

Please remember that the stock market is a risky place, especially now.  I am not providing recommendations for you to follow.  My goal is to share tools and methods that I have used over the past 40 years of trading, so that you may learn from them and adapt them to your trading style and needs.  While I do my best, I do not guarantee the accuracy of any statistics computed or any resources linked to my blog.  Please consult with your financial adviser and a mental health practitioner before you enter the stock market,  and please do not take unaffordable risks in the current market environment.  See the About section for more statements designed to protect you (and me) as you navigate this market. Past performance does not guarantee future results, but I would rather learn from a former winner than a loser.
GMI: +6, ETF winners and losers; Interest rates

To my visitors: I am only one trader, not a guru, and not a financial advisor.  I am presenting my own opinions and my own experiences and people are welcome to decide for themselves what, if anything, on this site is of value to them.  Please refer to the additional comments, highlighted in red, at the end of this post.

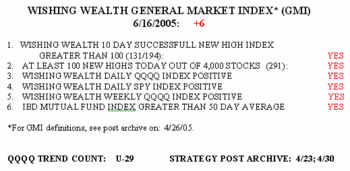
The GMI remains at +6 and the tech stocks continue to lead this rally.Gmi616 There were 291 new highs today in my universe of 4,000 stocks and only 12 new lows.  This is the greatest ratio of new highs to new lows since I posted the GMI on April 26.  By the way, a number of you have asked me how I compute the GMI–just check out my post in the archive on 4/26.  68% of the Nasdaq 100 stocks rose today, 69% of the S&P 500 stocks and 57% of the Dow 30.  This is turning into a respectable rally, having lasted for 29 days (U-29).

I thought you might like to see what ETF’s (exchange traded funds)have performed best in this period.  So, I used TC2005 to run a scan of ETF’s when the QQQQ advanced 5.2%.  The winners are OIH (+10.5%, oil service); EWW (+9.5%, Mexico stocks); IGW (+9%, semiconductors); IYE (+8.8%, energy); PWT and XLE (+8.6%, energy) and IIH (+8.5%, internet).  Clearly the oil and energy sectors were the place to be.  Will they continue to lead this rally? 

The biggest losers include EZA (-5%, South Africa); BHH (-4.5%, B2B internet); EWK (-2.8% Belgium) and EWJ (-1.6%, Japan). Other more traditional sector ETF’s that were weak include PPH, IXP, XLP and XLV. PPH (-1%) includes all of those wonderful pharmaceutical stocks (LLY, BMY, JNJ, WYE, SGP, MRK, VRX—these stocks declined 2.3-13.6% in this period) that the pundits have been recommending  to conservative investors in difficult times (like these??) I told you weeks ago that JNJ looked sick.

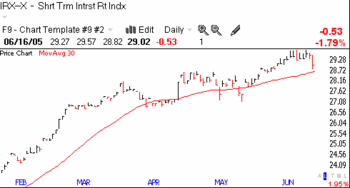
By the way, the short term interest rate index I have been monitoringIrx616 cracked today. Speculators are betting less on interest rate hikes, at least today they did. (Click on chart to enlarge.)

Send your feedback and questions to: silentknight@wishingwealthblog.com.

Please remember that the stock market is a risky place, especially now.  I am not providing recommendations for you to follow.  My goal is to share tools and methods that I have used over the past 40 years of trading, so that you may learn from them and adapt them to your trading style and needs.  While I do my best, I do not guarantee the accuracy of any statistics computed or any resources linked to my blog.  Please consult with your financial adviser and a mental health practitioner before you enter the stock market,  and please do not take unaffordable risks in the current market environment.  See the About section for more statements designed to protect you (and me) as you navigate this market. Past performance does not guarantee future results, but I would rather learn from a former winner than a loser.
Cramer and limit orders; ORCT and PNRA; GMI back to +5

Tonight, Cramer was upset that some of his listeners rushed out to buy Costco at the open this morning, based on his recommendation the night before,  and then got burned by buying at the high of the day (COST opened at 46.32 and closed at 45.49).  He screamed tonight that no one should use market orders–that brokers use market orders as a way of ripping off customers and selling to them stock  at an overly high price.  (A market order tells the broker to buy the stock at the next best price offered, whatever it is, without any limit.  In a limit order customers specify the maximum price they will pay to buy the stock.  If the stock opens higher than the limit price the broker can only buy the shares  if the stock comes back down to the limit price.)

One of the gurus I admire, I do not remember which, once said that fortunes have been lost by persons trying to hold out for the last 1/8th of a point on a buy or sell order.  If COST had opened at 46.32 and never traded lower today, a limit order below that price would never have been executed and the customer would have lost out on an explosive rise.  I therefore almost always trade using market orders. If I want to buy a stock I want to buy at the next best price.  I do not want to miss out on a move.  Similarly, if I want to sell because I think a stock might decline, I want to get out immediately.  I don’t worry about a few cents either way.  It could be suicide to put a limit order in on a sell and not be able to sell because the stock never traded at my limit price.  BUY AND SELL AT THE MARKET!  When I place a stop loss order at a price below which the stock is trading, it means that if the stock falls to that price,  get me out!

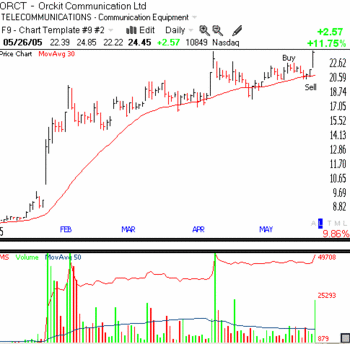
I am going to give you an example of a trade I made today that should illustrate these principles.Orct   One of my market scans alerted me to ORCT–a potential rocket.  Note the huge volume and rises in late January and early April.  On May 16, I purchased some of the stock (see "Buy" on chart) when I saw the stock bouncing from its moving average.  I immediately placed a sell stop (stop loss order) in to sell the stock if it fell below its moving average.  The  stock peaked on the day after I bought it and slowly returned to its average.  After this peak, I placed a stop order to buy more shares if the stock should reverse and trade above the peak of  22.90. Thus, I placed a buy stop order at 22.95 which meant that if the stock traded at 22.95 or higher, the order would become a market order to buy ORCT at the next best price.  However, before that second buy order was triggered,  my stop loss order automatically sold my ORCT shares on 5/23 when it broke below its moving average.  I was also tired of seeing the stock go nowhere in a strong market.

Now here is my point.  I did not get angry or discouraged at the way the stock had acted.  I simply automatically took my small loss.  But, just in case the stock should again reverse and break through the peak at 22.90, I left my buy stop order in place at 22.95.  How many times have I been shaken out of a stock only to have it immediately turn around and go up.  And wouldn’t you know, today, without my having to pay any attention to it, my order to buy ORCT was triggered and I bought some at 22.98.  The stock then rocketed to a new high on huge volume and closed at 24.45 today.  My stop order to buy automatically got me into the stock at the breakout point and had I used a stop limit order to buy ORCT (an order that becomes a limit order to buy at or below the limit price once the stock trades at the stop price) I might have missed climbing aboard. Some of my best trades have come from buying back shares that I had recently been scared out of by a sudden decline, when they bounced back……………………………………………

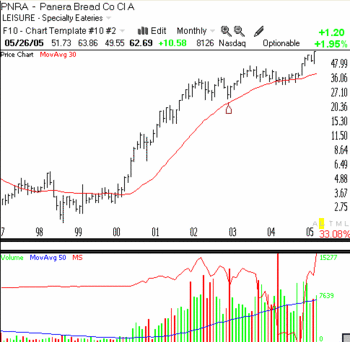
It is the greatest irony that my IBD Meetup group meets each month at the local Panera Bread shop and exchanges ideas on the next great stock.  Last night our surviving triumvirate (see yesterday’s post) was sitting at a table watching the long line of patrons.Pnra   Do you know the Peter Lynch (the successful manager of Fidelity’s Magellan fund in the 80’s)method of picking stocks?  He talks about visiting malls and observing checkout lines to see which companies are thriving, as a way of finding promising businesses.  Well, it turns out that while we were looking for winners in our chart books, a major winner was right under our noses!   PNRA (click on monthly chart to enlarge) rose about 14 fold between 2000-03 (yes, during the collapse of the Nasdaq), and then plateaued for 15 months.  In January, 2005, it burst out to a new high and is now in an uptrend, hitting a new high of 63.86 today.  Panera Bread may be a great place to make some dough in the months to come. (I couldn’t resist the pun.)

  Over the years I have noticed the wisdom of Lynch’s method.  As an avid Mac user in the early 80’s I noticed that all of the software came from the same company–something called Microsoft.  I called my broker when it went public and asked to buy some shares at the offering price of $26.  He laughed, and said I would have to buy it when it began trading.  When it opened around $40 I figured I had missed the boat.  How little I knew back then.  I didn’t make the same mistake with GOOG.  And I bought XMSR at around $2 because my son told me how great satellite radio was.  My point is to look around at the products that people in your life are enthusiastically embracing (ever hear of IPOD–too late now) and research the company immediately.  All of us have special interests and domains that we know well and which can alert us to the next winner…………………….

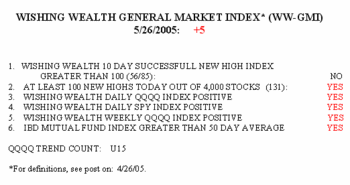
Do you wonder why I show you the GMI every day?  The reason is to remind you that a crucial key to successful trading is to be in harmony with the general market trend.Gmi526    This is the "M" in the CANSLIM approach and it is a critical element in the strategies of all of the gurus I have studied. The GMI regained +5 today because there were more than 100 stocks that reached new highs out of my universe of 4,000 stocks.  The important thing to note is that 85% of the stocks in the Nasdaq 100 rose today along with 79% of the stocks in the S&P 500 and 77% of the Dow 30.  Aren’t our chances of making successful purchases greatly increased when we have such company?  If you bought a Nasdaq 100 stock on Wednesday, you had an 85% chance of having a profit by today.  Since May 5, the QQQQ (an ETF that tracks the Nasdaq 100 stocks) has climbed 6.8% and 88 of the Nasdaq 100 stocks have increased and 28 of the 100 have increased 10% or more.  If you are still shorting or are short tech stocks, these are the steep odds you are fighting.  I am making $$$ in this market, and it is all because I am in synch with the trend. 

Send me your feedback at silentknight@wishingwealthblog.com

Please remember that the stock market is a risky place, especially now.  I am not providing recommendations for you to follow.  My goal is to share tools and methods that I have used over the past 40 years of trading, so that you may learn from them and adapt them to your trading style and needs.  While I do my best, I do not guarantee the accuracy of any statistics computed or any resources linked to my blog.  Please consult with your financial adviser and a mental health practitioner before you enter the stock market,  and please do not take unaffordable risks in the current market environment.  See the About section for more statements designed to protect you (and me) as you navigate this market. Past performance does not guarantee future results, but I would rather learn from a former winner than a loser.