GMI: +1; WPM shows weakening; Folly of fighting market’s trend; On Nicolas Darvas

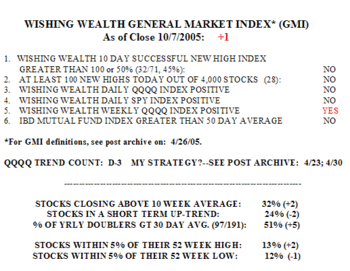
What a devastating week for the bulls.     The market internals continue to weaken, with only 24% of stocks in my universe of 4,000 in a short term up-trend.   The GMI remains at +1, with only the Weekly QQQQ Index still barely positive.   There were only 28 new highs on Friday and three times as many new lows.   On Friday, only 55% of the Nasdaq 100 stocks, 66% of the S&P 500 and 50% of the Dow 30 stocks advanced, an insignificant bounce up from the week long decline.   Friday was the third day in the QQQQ down-trend (D-3).   Since its peak on August 2, the QQQQ   (Nasdaq 100 ETF) has declined 4.3% and only 34% of its component stocks have advanced, with only 18 stocks (18%) advancing 5% or more.   Why fight these odds?

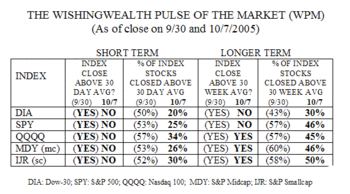
The WPM shows the extraordinary weakness in the short and long term trend measures of   five market indexes.     All five indexes are below their 30 day averages and only 20-34% of their component stocks are above their 30 day averages.   The Dow 30 stocks continue to show the greatest weakness, short and long term.   The big industrial Gmi1007companies are clearly weak.   The DIA and SPY ETF’s are both below their 30 week averages, an indication of longer term weakness in trend.   Only 30-50% of the component stocks in all five indexes closed above their 30 week averages, suggesting that all of these indexes may find themselves below this key average soon……….
It has taken me 40+ years of trading to understand the folly of fighting the overall market trend.   Whether I look at Livermore’s “line of least resistance,” or O’Neil’s “M” in CANSLIM, or Nicolas Darvas’ writings (See Boik’s books at right) I find these gurus all saying that there is a time to be out of the market when it is declining, or to be short.   This is a very difficult rule to follow because even in weak markets, I am tempted to go long when I find the “perfect” text book price pattern that brought huge profits in a prior rising market.   The critical point to remember is that the same price pattern that works so well in a rising market, is likely to fail in a declining market.  Half of the battle for Wpm1007conserving capital is to resist the temptation to buy that unusually strong stock in a bad market.   The odds of success are against me.   And yet, being in the market is so seductive.   (One way I handle such a temptation is to use a very small portion of my portfolio to buy that irresistible stock–just in case I am right.) This topic is so important, I will prepare another post this weekend that will delve into the writings of my favorite guru, Nicolas Darvas, as they apply to the importance of following the market trend.
Critical week ahead; GMI: +6; little change in WPM; Longs and shorts

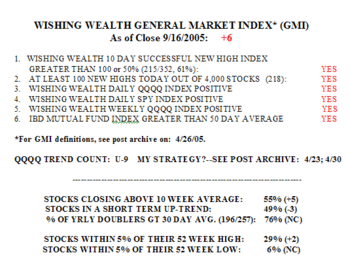
This could be the most important week technically for the market since the QQQQ bottomed on August 29.  The primary indexes as measured by the DIA, QQQQ and SPY all tell me the same technical story.  But first I will review the GMI and WPM indicators.  Gmi916

The GMI has registered+6 since September 6, and Friday marks the ninth day in this QQQQ up-trend. There were 218 new yearly highs on Friday in my universe of 4,000 stocks. 61% (215/352) of the stocks that hit a new high 10 days ago closed higher Friday than they closed 10 days earlier.  Thus, traders buying new highs 10 days ago and holding on, had a better than even chance of having a profit by Friday’s close.  This is a bulllish sign because when stocks at new highs begin to falter, the market tends to weaken.  Another sign of strength in the leaders is that about three quarters (76%) of the stocks that doubled in the past year closed above their 30 day averages.   This strength in the leaders does not extend to most stocks. Only slightly more than one half (55%) of the 4,000 stocks in my universe closed above their 10 week averages, and  about one half (49%) remain in a short term up-trend.  Nevertheless, more stocks are within 5% of their yearly highs (29%) than their yearly lows (6%).

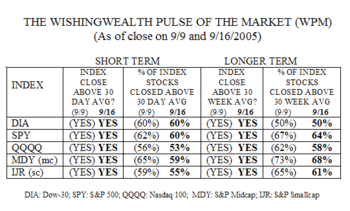
The WPM reveals no meaningful changes in the market internals since last weekend. Wpm916 All 5 indexes remain above their short term (30 day) and longer term (30 week) moving averages. Similarly, 50% or more of all of their component stocks remain above these averages.  The largest changes (declines) occurred within the midcap stock ETF (MDY).

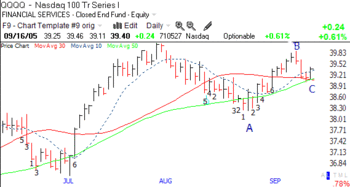
So what is going in here?  As I read it, the up-trend is still intact in all of these markets.  However, the indexes came very close to violating their short term averages this week.  This QQQQ chart is almost identical to that of the SPY and DIA.  (The numbers in black show the changes in the GMI over time, click on to enlarge.)  Qqqq916 Note that the QQQQ bottomed in late August (point A) and then started a rise that topped out on Tuesday (B). On Thursday and Friday the QQQQ bounced off of the flat 30 day (red line) and rising 50 day (green line) moving averages (C), which have converegd.  The fact that these two averages are almost identical means that the market has basically not changed over these 2 periods (the average of the closes over the past 30 days is the same as the average over the past 50 days).  This is especially important because, similar to the behavior of Bollinger Bands, when the averages converge on each other, it often means that a significant move will occur once a direction is taken.  It is almost like a compressed spring, which expands quickly when released.  The fact that the 10 day average (dotted line) is above the other 2 averages is bullish.  The critical signal for me is whether the QQQQ closes and remains above or below its 30 day average this week. A close above point B on increased volume would be very bullish.  Remember, the technical pattern I have described is identical for the DIA and SPY. The direction of the entire market may be at stake………………………….

The safest strategy for now is for me to hold a watchlist of stocks to buy or sell after a definitive signal is given for the general market trend.  Remember, most stocks go with the market trend and it is therefore safer to trade with the trend. I have run scans for weak and strong stocks. Among the short candidates I am watching are:  WYNN, TECD, CCL, WON, NEW , DECK, YHOO.   (Yes, even Yahoo looks sick to me now.)  Long candidates include:  AAPL, SMTS, KEYW and UPL.  Of course, I will only make these transactions after researching them more and I always place a suitable stop loss. 

Please send me your feedback at: silentknight@wishingwealthblog.com.

GMI: +6; New “doubler” indicator; GMI and QQQQ trends; WPM shows short AND longer term strength; Staying long

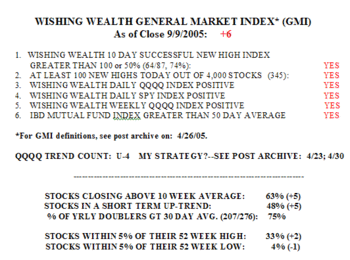
The market closed the week strong with the GMI at a max +6.  This blog has helped me to systematize my trading and stay with the market.  By focusing on the GMI and ignoring everyone’s opinions I have been able to remain with the market’s trend.  One must trade with "what is" and not what I think or hope should be.  As I have written before, if a truck is bearing down on me, it makes no sense to question whether it should be there or heading in my direction.  I must react quickly to what is happening. Gmi909_1 And right now, the GMI is firing on all cylinders.  There were 345 new yearly highs on Friday, and 81% of the S&P 500 stocks and 83% of the Dow 30 stocks advanced. The Nasdaq 100 stocks lagged a little, with 66% advancing.  Almost three quarters (74%) of the 87 stocks that hit new highs 10 days earlier closed higher on Friday than they closed 10 days earlier.  The percentage of stocks in my universe of 4,000 closing above their 10 week averages rose to 63%, highest since 7/29.  And 48% of stocks are in a short term up-trend, the highest number since 7/29.  One third of stocks are within 5% of their yearly highs.  Friday was the fourth day (U-4) in the QQQQ up-trend.

I added a new indicator to the GMI table–% of yearly doublers greater than their 30 day averages.  This indicator tracks the technical strength of all stocks in my universe of 4,000 that have doubled in the past year and traded at least 10,000 shares on that day.    This indicator will tell me when the past year’s leaders are weakening, at least short term.  Weakness in the market leaders often times precedes general market weakness.  The list of doublers will be recalculated at each day’s close by TC2005, according to the criteria I mentioned above.  The total number of doublers in the past year will therefore also provide an indication of the strength of the market. As of Friday, 75% of the 276 doublers closed above their 30 day averages.

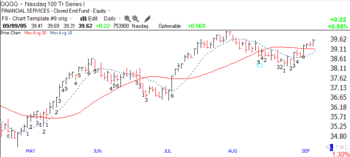
As I noted above, the GMI has helped me to stay with the market trend. Gmichanges909_1 This chart (click on to enlarge) shows the changes in the GMI since I started posting it in April.  Note that the GMI remained at +6 from the beginning of the rise on July 8 until August 16, and then declined with the market.  The GMI returned to +6 on September 6 .  You can judge for yourself whether The GMI has been useful for detecting meaningful changes in the market’s trends. Note in the chart that the 10 day average (dotted line) is about to cross above the 30 day average (red line).  This would be another confirmation of a rising trend in the QQQQ.

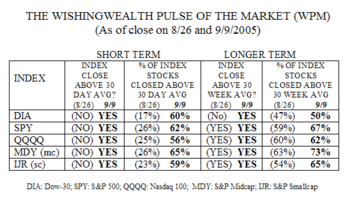
But the strength is not limited to the QQQQ.  The WPM has strengthened considerably since I last updated it on 8/26. Wpm909 All 5 indexes are now above their 30 day and 30 week averages.  The DIA had given a false signal when it closed below its 30 week average for 2 weeks. Major increases have occurred in the percentage of stocks closing above their 30 day averages, with the range being 56%-65%, up from 17%-26%.  The majority of the stocks in all of these indexes are now in short term up-trends.  The percentage of stocks closing above their 30 week averages also increased, to 50%-73%.  Midcap stocks in the MDY appear to be the strongest group of stocks–short and longer term. (Sometimes I think I should only trade these index ETF’s.)

This strength in the market in the midst of post-Katrina anxiety and general pessimism about the economy is to me a screaming buy signal.  So I have committed most of my resources to the long side of the market.  I have to ignore my emotional tendencies and stay with what the market is doing.  As I begin to trust my indicators more and more, it has become easier to remain consistent with them and to tune out all other influences.  As you know, I am a chicken and will jettison all of my long holdings when my indicators detect market weakness.

Will GOOG burst through $300 this week?

Please send me your feedback at: silentknight@wishingwealthblog.com.