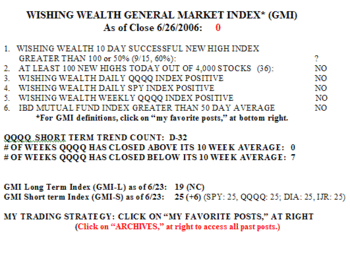
The GMI remains at zero, but there were almost enough successful new highs from 10 days ago (9/15= 60%) to turn this indicator positive. While I typically call this index positive when 50% or more of the stocks that hit a new high 10 days ago close higher then they did 10 days ago, the numbers here are too small to do so. If it is above 50% again tomorrow, I will make the indicator positive.  There were 36 new highs and 95 new lows in my universe of nearly 4,000 stocks. 65% of the Nasdaq 100 stocks advanced on Monday, along with 74% of the S&P 500 and 80% of the Dow 30 stocks. Monday was the 32nd day of the current QQQQ down-trend. 14% of the stocks in my universe are in an up-trend, compared with just 9% at the lows last week. So stocks are getting stronger.
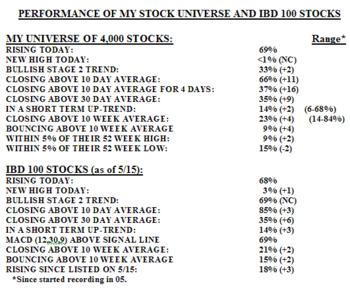
The IBD 100 growth stocks from 5/15 now look as strong as the stocks in my universe. This contrasts with the way they acted during the recent decline, when they greatly underperformed other stocks. Traders and funds were clearly unloading the premier growth stocks in the IBD 100 list.  Three IBD 100 stocks did hit a new high on Monday: XPRSA, CLDN, OII. Any of the IBD 100 stocks that could survive the decline of the past month and go on quickly to hit a new high is a stock worth watching. 69% of the IBD 100 stocks from 5/15 have a MACD above their signal lines, indicating growing strength. Still, note that only 18 of these 100 stocks closed higher on Tuesday than they did on 5/15 when this list was published by IBD…….
There are now new ways for an investor/trader to short the major market indexes in an IRA without buying put options. Inverse ETF’s have been born. They move in the opposite direction of the indexes they track. So, to short the Nasdaq 100 (QQQQ) index, one can buy PSQ. Other inverse ETF’s include: SH (S&P 500); DOW 30 (DOG) MYY (S&P 400 midcap). These ETF’s are thinly traded and should be researched carefully before buying.
Maybe the dawn of a new set of inverse ETF’s is a bullish sign. Typically, not long after investors are so interested in a sector that a relevant new ETF is issued, that sector is close to a top–check out XHB, GLD and SLV for recent examples. Too many people may be interested in shorting the major indexes??!! A new contrary indicator?
Please send your comments to: silentknight@wishingwealthblog.com.
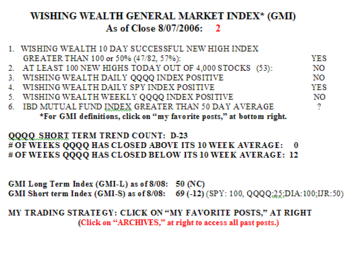
 In contrast, the SPY and DIA indicators remain strong. Monday was the 23rd day in the current short term decline in the QQQQ. However, the IBD 100 stocks of 5/15 outperformed the general market on Monday. 54% of the IBD 100 stocks from 5/15 advanced while only 32% of the 4,000 stocks in my universe advanced. I do not yet know if the IBD Mutual Fund Index has turned positive. My TC2005 scan of the market yielded 282 submarines and nine rockets. With the GMI at +2, it is a good time to sit back in cash. The growing strength in the IBD 100 growth stocks suggests that there is interest in acquiring stocks with good fundamentals.

