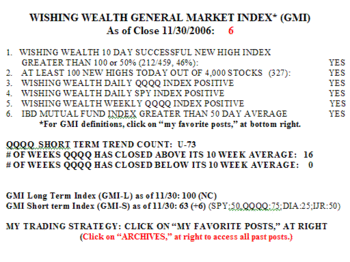
The GMI is still 6, as 50-55% of the stocks in the Nasdaq 100, S&P 500 and Dow 30 indexes advanced on Thursday.  There were 327 new yearly highs in my universe of 4,000 stocks. Interestingly, IJR (S&P 600 SmallCap ETF) showed a little strength on Thursday, causing the GMI-S to climb to 63. As you probably know, small cap stocks are said to show strength around January. Thursday was the 73rd day in the current QQQQ up-trend.
ETF
GMI: 6; We don’t have to catch the exact bottom to profit
I do not often recommend individual stocks, but after the close on 10/4, I wrote: "I am riding high with the QLD, a ProShares ETF that moves twice as much as the QQQQ, which it mimics. I am also holding IAI, an ETF of U.S. brokerage stocks, a group that typically rises in bull markets when trading volume expands. Why not own a piece of the casinos. Other stocks that came alive today include RIMM, and finally GOOG, both of which I own." Since I posted the above on 10/4, QLD has increased +15%, IAI is up +8%, GOOG is up +22% and RIMM is up +27%. One did not have to catch the bottom in August to profit from this rise. Contrary to what many pundits claim, there is plenty of time to catch the train after it has left the station……
The GMI is still at the maximum reading of 6. On Tuesday there were 275 new yearly highs in my universe of 4,000 stocks. 53% of the Nasdaq 100 stocks rose, as did 54% of the S&P 500 stocks and 43% of the Dow 30 stocks. 63% of the stocks on the IBD 100 list for 11/20 advanced on Tuesday. 73% of the Nasdaq 100 stocks closed above their 30 day averages, well below the peak of 88% reached on 10/16.  76% of the stocks in my universe closed above their 10 week averages, also below the peak of 83% reached on 10/16. October 16 was the last short term peak in the QQQQ. So, it looks like this rally has more to go before these two indicators reach the heights attained when the market hit a minor peak in mid-October.
GMI: 6; QLD outperforms even the IBD 100; GOOG to take off?
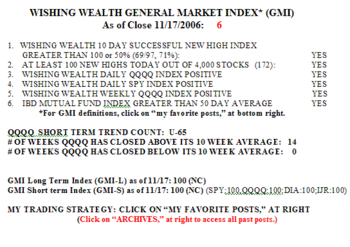
The GMI remains at 6. Only 42% of the Nasdaq 100 stocks advanced on Friday, along with 41% of the S&P 500 stocks and 57% of the Dow 30 stocks.  There were 172 new 52 week highs in my universe of 4,000 stocks. Friday was the 65th day in the current QQQQ up-trend. The GMI-L and GMI-S are both at 100, indicating that long and short term indicators for four indexes are positive. Since this up-trend began on 8/16, the QQQQ has advanced 14.8% and the Ultra QQQQ ETF, QLD, has advanced 29.3%. As I have been saying all along, by just riding the QLD, one would have beaten 90% of the Nasdaq 100 stocks and 95% of the S&P 500 stocks. In fact, only 14 of the IBD 100 stocks from 8/14 advanced more than the QLD. What a way to ride an up-trend by just jumping aboard the QLD! And the volatility (and risk) of the QLD is far less than that of individual stocks.
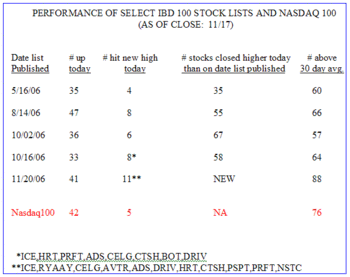
The IBD 100 stocks have been performing better of late.  The majority of the stocks in the recent IBD 100 lists have closed above their average closes of the last 30 days. With the exception of the list from 5/16, the majority of the stocks on the lists closed higher on Friday than when the list came out. Note that the stocks on today’s list had 11 new highs on Friday and 88% of them closed above their 30 day averages. New lists are apparently skewed towards stocks that have been rising in the past month. It will be interesting to see how the stocks on today’s list do towards the end of the year.
By the way, GOOG had a hard time getting above $500 last week. Is it possible that traders wanted to hold the November 500 calls below 500?(so they would expire worthless) It will be interesting to see if GOOG takes off now that option expiration is over……