My post from the bear market bottom; weak TJX; GMMA shows QQQQ in strong up-trend

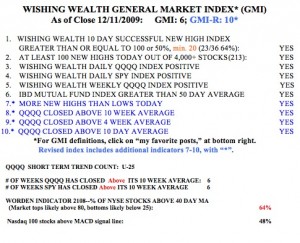
GMI6/6
GMI-R10/10
T210876%

“Last week, a person who knows nothing about the market asked me how to short stocks.   This is reminiscent of the  stories of the shoeshine boys providing stock tips, near the roaring 20’s market’s top.   The sentiment is just too negative right now.   Does this mean the market has to turn up?   Not necessarily, but the market is always an assessment of competing probabilities.  â€œ (Post on 3/8/2009, GMI: 0, T2108: 7%)

I wrote the above words last March, which turned out to be just as the market successfully tested its bear market lows and   began the current rise.   The Worden T2108 indicator was   in single digits, a rare screaming oversold buy signal.   When people around me who never traded asked me how to short stocks it turned out to be a key contrary signal that the market decline was near an end.   Similarly, I remember when a friend who knows little about the market asked me if he should refinance his house to invest in the market–back in 2000 near that market’s top………

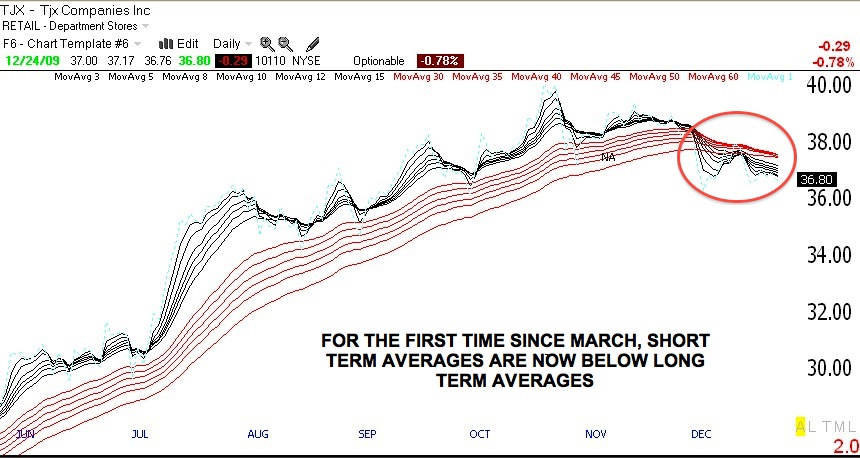
I have noticed that the pundits have been saying that TJX , the discount retailer chain, is a good buy. I therefore was struck by the GMMA daily chart below, which is flashing warning signals. With the short term averages (black lines) now below the longer term averages (red), this is not a stock I would want to own.   It may even be a good short play.   You do know that analysts sometimes tout a stock so that their big clients can unload their long positions to the unsuspecting public. (The “NA” on the chart shows when IBD wrote about TJX in its New America column.) Another stock with similarly weak technicals is PWRD.

TJX--GMMA

Meanwhile, the GMI and GMI-R

Read more

AAPL still a concern; QQQQ holding up

GMI6/6
GMI-R10/10
T210864%

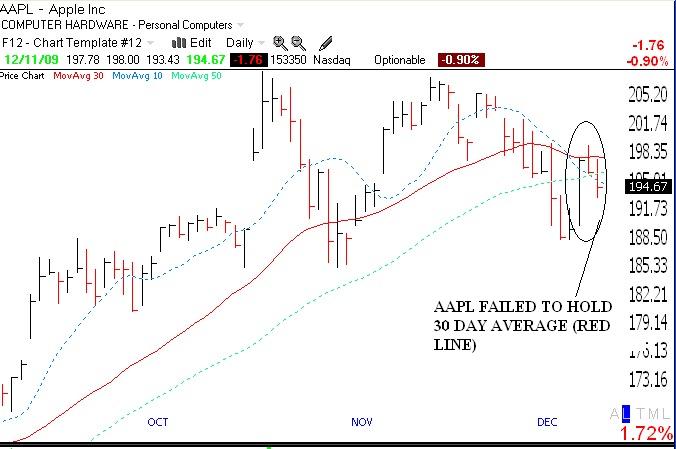
I am still concerned that AAPL (and NFLX) is showing technical weakness.   On Friday, the stock could not hold its 30 day average and its 10 day average (blue dotted line) remains below its 30 day average.  GMI12112009 See the daily chart for AAPL below. While AAPL could always break above its 30 day this week, until it does, it may be flashing a short term down-trend. Another stock that I am short is EMS, which   may also be flashing a sell signal.   EMS may have formed a head and shoulders top. Nevertheless, the   GMI and GMI-R are at their maximum values.   So the QQQQ (Nasdaq 100 ETF)   is still in   short and longer term up-trends. The Worden T2108 Indicator is at 65%, in neutral territory.   The daily stochastics for the QQQQ are flat and in neutral territory.   So I continue to ride QLD but remain cautious, with the weakness in AAPL and NFLX.

AAPL12112009

Market up-trend back on track after bouncing off of Bollinger band; Gold shines, STEC falters.

GMI5/6
GMI-R9/10
T210841%

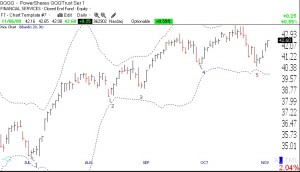
Well, the indexes again bounced off of their lower Bollinger bands and the market’s short term up-trend resumed. Note the 5th bounce that I just added in red to the chart I posted on 10/19 after four bounces.  BOLLINGERQQQQ1108 Review that post if you want to understand the logic of Bollinger bands. If only I had the patience to wait for the bounce to enter my long positions! Maybe next time.   The QQQQ is even back above its 10 week average!   So, as much as I hate being whipsawed by the recent decline, if I flew solely by instrument, I would have to be long again.   But watch out for a possible right shoulder forming in a head and shoulder pattern.   If the QQQQ falters before it surpasses the peak reached on 10/21, we could see a large drop, especially if QQQQ closes below the neckline, around 40.6 .   So, if I go long, I will place some close sell stops and monitor QQQQ’s   progress very carefully.   Meanwhile, the GMI is

Read more