GOOG, MW, Other rockets, fabricated fantasy revisited, GMI +5

To my visitors: I am only one trader, not a guru, and not a financial advisor.  I am presenting my own opinions and my own experiences and people are welcome to decide for themselves what, if anything, on this site is of value to them.  Please refer to the additional comments, highlighted in red, at the end of this post.

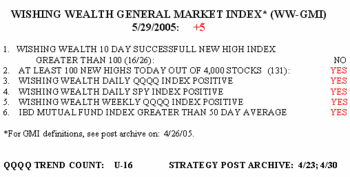
The GMI (see post 4/26) remains at +5 and the QQQQ uptrend is in its 16th (U-16) day.Gmi529 There were 131 new 52 week highs (in my universe of close to 4,000 stocks) and only 14 new lows on Friday.  The successful 10 day new high index was quite low, at 16.  Nevertheless, most (16/26) of the stocks that hit new highs 10 days ago did close higher Friday than they closed 10 days earlier. While there were 21 successful new 10 day lows, they constituted a minority of the 117 stocks that hit new lows 10 days earlier. Thus, betting on new highs 10 days ago tended to be more profitable, even though there were not many……………………….
I am still amazed by the pundits who are remaining skeptical about this rally, including Alan Abelson, the author of Barron’s Up & Down Wall Street column.  As I wrote on Thursday, this has been a good tradeable rally and if you somehow missed it or are still resisting it, you may want to re-examine your methods and your psychology. Why do so many people need a reason for the market to rally.  If there are good reasons, they almost always come out after the move.  If the train or rocket is moving, why should we fixate on an explanation–just jump on board.  I guess I am an orthodox agnostic when it comes to believing in a rationale for stock movements.  Meanwhile, the IBD Mutual Fund Index is rising nicely above its 50 day average, signifying that growth oriented funds are rising–so someone is buying growth stocks…………………………………………….

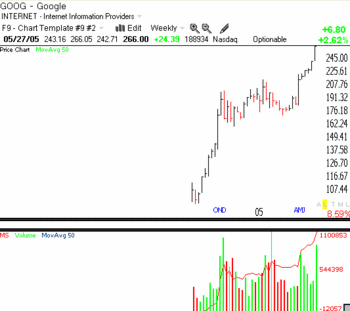
I told you I started buying GOOG after it gapped up around 221 in the last week in April.  GOOG closed near its all time high on Friday at 266, up +24.39 for the week. Goog3   I am starting to become worried that too many pundits are recommending GOOG–it even became the number one stock in IBD’s 100 list in Tuesday’s edition. While I have told you that I disavow all stock scenarios, let me suggest one.  I would not be surprised to see GOOG close around 300 by the end of June.  The end of the quarter brings that famous "window dressing" period when mutual fund managers are rumored to load up on the current quarter’s winners so that they can look smart when they publish their quarterly reports listing their holdings.  (If this misleading practice really happens–and John Bogle told me a few years ago that it does not, why doesn’t the SEC require that all funds list the date and price of all stocks purchased in the reporting quarter?) Anyway, since GOOG was initially offered to the public in a dutch auction and most mutual funds could not load up at the initial offering price, maybe there will be a stampede in June by the fund managers trying to accumulate the high flying GOOG?  Hence my hunch that $300 per share may be attainable in June………………………..
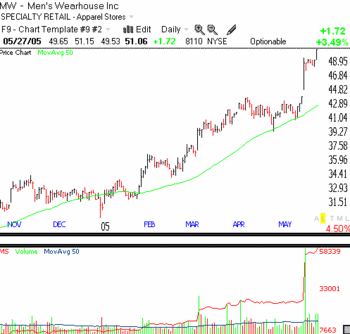
I talked to you last post, about Peter Lynch’s strategy of finding possible winners by scouting the shopping malls.  It occurred to me that there is a store I often visit that seems to offer the best combination of service and prices in men’s clothing.Mw   I like their stores much better than the department stores and their prices are more reasonable.  It just so happens that their stock, MW, has popped up on some of my market scans.  Mens Warehouse meets my criteria of a launched rocket.  The company gapped up on large volume after it announced its earnings on May 18 and declared a 3 for 2 split.  MW is also rated A+ by the IBD stock checkup.  So, MW is a winner.  The question is where to buy it.  It clearly is extended, far above its moving average.  If I were to take a chance on MW now, I would buy a few shares on Tuesday and place an immediate sell stop below the last mini reaction low of 49.40, perhaps at 49.20 or 48.95. If I got stopped out, I would buy it again if it bounces near its 50 day average.  (This is not a recommendation but only for illustrative purposes.)
My rocket scan picked up several other promising stocks, all rated A+ by IBD:  FORD, PTC, LCAV, FTO, QSII, HANS.  Check them out. (I own one of these.)  If the rally continues, I may bet on more of these rockets……………………

I’ve been thinking about my comment on fabricated fantasies on 5/24. I wrote, "What if Darvas is right?  All of these people and institutions who are paid millions of dollars for their financial advice are simply involved in a world of fabricated fantasy."  The more I thought about it the more I thought I was unduly critical of the fundamental approach.  In a sense, we are all looking for the criteria for picking winning stocks, we just employ different criteria.  The technician uses mainly price and volume patterns, while the fundamental analyst uses estimated value and economic statistics.  This is what I have realized since my post:  both strategies fit well within Darvas’ concept of the market as a big casino.  We are all using our tools to predict other persons’ buying our stock from us at a higher level.  Both groups are playing the same gambling game he described!

By the way, fundamental analysts sometimes ridicule technicians’  search for "momentum" stocks.  Correct me if I am wrong, momentum means movement, and we all want a stock that will move up quickly after we buy it.  What’s so wrong with momentum? Stagnation is deadly and costly in life and in stocks…………………………………………

Send me your feedback at silentknight@wishingwealthblog.com

Please remember that the stock market is a risky place, especially now.  I am not providing recommendations for you to follow.  My goal is to share tools and methods that I have used over the past 40 years of trading, so that you may learn from them and adapt them to your trading style and needs.  While I do my best, I do not guarantee the accuracy of any statistics computed or any resources linked to my blog.  Please consult with your financial adviser and a mental health practitioner before you enter the stock market,  and please do not take unaffordable risks in the current market environment.  See the About section for more statements designed to protect you (and me) as you navigate this market. Past performance does not guarantee future results, but I would rather learn from a former winner than a loser.
Darvas’ stock market casino, fabricated fantasy, interest rates resume rise, a new trend count; GMI: +5

"It means, as I see it, that the corporation gets the money it needs, absolutely free and clear of any obligation to repay it–ever.  The underwriters get their cut or commission (or both) for placing the stock issue.  The stockbrokers who handle all subsequent transactions in the stock get their commission.  And the public will get "shares" (i.e., chips) with which to gamble–the gamble being, of course, that someone else will pay you a profit on them in the hope of selling them to a third person for a little bit more , and so on in an endless cycle of speculation.  This is, in essence, the entire story of the stock market, as I have found it."

Nicolas Darvas, Wall Street: The Other Las Vegas, Kensington Publishing, 1964, p. 54-55.

I read Darvas’ books in the 1960’s and they had and continue to have a profound impact on my approach to the market.  I know that William O’Neil and some of his colleagues have also referred to Darvas’ influence on their trading strategies.  Here is a man, Darvas, who made almost 2 million dollars in the stock market in 18 months while he danced around the world, subsequently saying that the stock market was just a venue for gambling.

After the internet bubble and the tech stocks collapsed so badly in 2000-02, I think many of the people who were so badly burned, would agree with Darvas.  Nevertheless, there persists an entire industry of people who attempt to make the market seem rational and spend lots of time analyzing the "true value" of stocks.  What if Darvas is right?  All of these people and institutions who are paid millions of dollars for their financial advice are simply involved in a world of fabricated fantasy.  If Darvas is right, the idea of having people trusting their economic futures (and social security) to the whims of the great stock market casino terrifies me. As Darvas says at the end his book, "I walk into the Casino with my eyes open as I would if I were walking into a Casino in Las Vegas.  I ignore the chatter, I watch the action; and, I try my luck."  I believe that this is our mission as market technicians. ……………………………………….

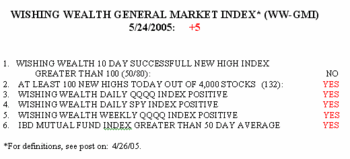
The GMI held at +5 today.  The market has weakened some, Gmi524 however, with only 132 new 52 week highs, down from 197 new highs on 5/18.  There were 28 new lows in my universe of almost 4,000 stocks.  Successful 10 day new highs were 50 today, down from 84 on 5/19.  Only 46% of the Nasdaq 100 stocks rose today, 41% of the S&P 500 stocks and 43% of the Dow 30.  Put another way, the majority of the stocks in these indexes declined or were unchanged today.  This rally may be taking a breather.  Note that the GMI is explained in my post on 4/26.

As long as the GMI stays at +5, I feel comfortable holding stocks and buying stocks that bounce off of support levels.  I am not as confident of buying new highs right now, however. Some of my stocks hit new highs today but closed near their lows of the day (GOOG, BOOM).

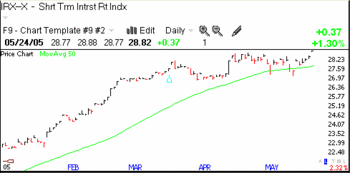
There is one big negative that I see.  The short term interestIrx524_1 rate index went to a new high today (click on figure to enlarge). Speculators are again betting on more Fed rate hikes and this could eventually torpedo the market.  If it does, the weakness will show up in the GMI.  Nevertheless, the resumption of the rise in this index just makes me a little more cautious about the possible longevity of this bull move…………………………………………….

I am introducing today another indicator I find useful.  I simply count the days since the current trend began.  Today is day 13 of the rally, as I define its inception.   I will use the term U-13 (for today’s count) to designate the duration of an uptrend. A downtrend will be indicated by D-xxx.  This indicator will help us to monitor the maturity of a trend.  At some point I will show you an analysis I did of the duration of up and down trends over the past few years.  It helps me to determine how likely it is that a trend will continue. In future posts I will include this trend count in the GMI indicator box.

Send me your feedback at silentknight@wishingwealthblog.com

Please remember that the stock market is a risky place, especially now.  I am not providing recommendations for you to follow.  My goal is to share tools and methods that I have used over the past 40 years of trading, so that you may learn from them and adapt them to your trading style and needs.  While I do my best, I do not guarantee the accuracy of any statistics computed or any resources linked to my blog.  Please consult with your financial adviser and a mental health practitioner before you enter the stock market,  and please do not take unaffordable risks in the current market environment.  See the About section for more statements designed to protect you (and me) as you navigate this market. Past performance does not guarantee future results, but I would rather learn from a former winner than a loser.
Livermore on profits, Cramer on sleepers and 15 Hot Stocks–WW-GMI: +3+

In explaining to Walter Chrysler (yes, THE man) why it was a mistake when he, Livermore, took a profit too soon in a trade, Jesse said:

"You remember that old joke about the guy who goes to the race track and bets on the daily double and wins, then takes all his winnings and bets it on the third race and wins. He does the same on all the other races, and wins.  Then on the eighth and final race, he takes his hundred thousand dollars in winnings and bets it all to win on a horse, and the horse loses.

Well, he’s walking out of the track and he meets a pal of his, who says, ‘How’d you do today?’

‘Not bad,’ he answers, smiling.  ‘I lost two bucks.’ " (the money he started with)

     Jesse Livermore, World’s Greatest Stock Trader, by Richard Smitten, 2001, p. 226

Livermore was saying he made a mistake by selling when he had a profit because he was scared of losing the money he had made.  He should not have been scared, however, because he was playing with the track’s money (the profits) and was not risking the money he started with.  Fear was not a valid reason for selling, the only good reason to exit a profitable trade, according to Livermore, is a technical signal resulting from the stock’s behavior.

One of the reasons that Jesse Livermore made (and lost) several fortunes in the market was that he averaged up on profitable trades and was not afraid to risk his profits.  Risking your capital, however, was suicide for a trader. This approach is similar to the one espoused by Loeb when he said to slowly average up as the trade worked out.  That way, you would not risk much of your original money.

Today, Jim Cramer espoused a strategy that was as antithetical as possible from the way the great traders (see book by John Boik) operated.  Cramer said to look for stocks that have not moved up, the sleepers, and to buy them because they would be more bullet proof in a possible decline.  Remember the quote from Crane that I posted a while ago saying that buy signals were simply evidence that a stock was already being bought by others?  Both Livermore and O’Neil  and Darvas talk about buying stocks that have demonstrated strength by bursting to new highs on unusual volume.  Why would anyone attempt to seek winners by finding stocks that are not moving in a rally!  (Now I can surmise why Cramer has said his wife, The Trading Goddess, had to rescue his hedge fund several times.) We already talked about not buying rockets that are sitting on the launch pad–they may never take off. The gurus I listen to have written that the big money is to be made in buying the leading stocks–the ones that burst to new highs as soon as the market gains strength.

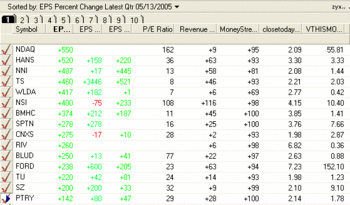
So, I decided to run a scan using TC2005, to find all  stocks (in my universe of 4,000) that hit a new 52 week high in the past 10 days.  I found 371 stocks.  I then ranked them by EPS gain in the past quarter and excluded all stocks with less than a 100% gain in earnings, that had not at least doubled in the past year and that were not trading near all time highs. Tc2000 The matrix shown here (click on it to enlarge) presents the 15 stocks that survived my screen, ranked by earnings gain the past quarter (the first EPS column).  The second EPS column is the increase in earnings 2 quarters ago, and the last EPS column is the increase over the past year.  An interesting characteristic of these stocks is that the PE (price divided by earnings per share) ratios are all below their earnings growth rates. This may be symptomatic of a market that has not yet bid up growth stocks to astronomical levels. The revenue column is revenue growth over the last 4 quarters.  The next column presents MoneyStream, the Worden TC2005 indicator similar to on-balance volume I described a few posts ago.  The next column shows the price today divided by the price 250 days ago, and the final column shows the volume this month divided by the volume 6 months ago.  A  rocket often has extraordinary increases in volume as it rises.

Not all of these stocks are buys.  However, I wanted to show you an effective way of screening powerful stocks and a way to present the information so it is easy to obtain a snapshot of some important fundamental and technical indicators by which to compare stocks. Of course, I want to buy such strong stocks only if the market is rising—-like now!!

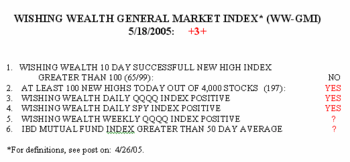
The market keeps growing stronger.  The GMI is +3+.  It is probably Gmi518_1 really a 4, because the IBD Mutual Fund Index was very close to its 50 day average as of this morning’s edition and the index probably broke above it with today’s advance.  When this index turns positive, it indicates that the mutual funds that concentrate in growth stocks are beginning to do well and augurs well for those of us who buy growth stocks.  There were 197 new 52 week highs in my universe of almost 4,000 stocks and only 30 new lows.  There were 65 successful 10 day highs and only 16 successful 10 day lows.  Increases occurred in 84% of the NASDAQ 100 stocks, 80% of the S+P500 stocks, and 87% of the DOW 30 stocks.

Right now the trend is up—finally.  Another sign of the turn is that some of my trader friends have abandoned the market and thrown in the towel on trading. Those of us who went short or stayed in cash these past difficult months can now take advantage of the bull trend. There is a time for every season…….

Send me your feedback at silentknight@wishingwealthblog.com

Please remember that the stock market is a risky place, especially now.  I am not providing recommendations for you to follow.  My goal is to share tools and methods that I have used over the past 40 years of trading, so that you may learn from them and adapt them to your trading style and needs.  While I do my best, I do not guarantee the accuracy of any statistics computed or any resources linked to my blog.  Please consult with your financial adviser and a mental health practitioner before you enter the stock market,  and please do not take unaffordable risks in the current market environment.  See the About section for more statements designed to protect you (and me) as you navigate this market. Past performance does not guarantee future results, but I would rather learn from a former winner than a loser.