What If?
What if……………
…no one can predict the stock market;
…high paid pundits only predict the past;
…Cramer is a modern day Elmer Gantry;
…the stock market is a big casino, a la Nicolas Darvas;
…to survive, analysts and brokers promote an illusion of order and complexity;
…psychology matters more than fundamentals and facts.
Then we might isolate ourselves from outside opinions, use our charts to maximize the chances of a gain, place our bets, and quickly and ruthlessly cut our losses. In harmony with the trend and with thoughtful trial and error, each small loss brings us closer to the next big gain………….
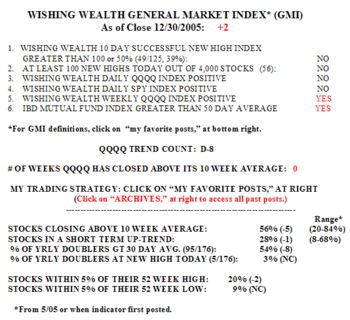
The GMI closed out the year with a +2. A short term down trend is in effect, while the longer term up trend remains intact. However, as we shall see below, the WPM shows some signs of weakening in the longer term trend of the component stocks of the five indexes I follow. One of the things that worries me is that the percentage of investment newsletters that are bullish is at 60.4%, with only 20.8% bearish. This is a contrary indicator–market peaks tend to be formed when most advisers are bullish.
There were only 56 new highs on Friday, and 45 new lows, in my universe of 4,000 stocks.  Only 39% of the 125 stocks that hit a new high ten days earlier closed higher on Friday than they did ten days before. 21% of the Nasdaq 100 stocks advanced, along with only 17% of the S&P 500 stocks and 7% (2) of the Dow 30 stocks. The QQQQ has now closed below its 10 week average for the first time in nine weeks. Only 56% of the stocks in my universe closed above their 10 week averages and a mere 28% are in a short term up trend. Just 3% of the 176 stocks that have doubled in the past 250 days hit a new high on Friday; the leaders have stalled. 20% of stocks remain within 5% of a new high. Friday was the eighth day (D-8) in the QQQQ down trend. Since this down trend was identified on 12/20, the QQQQ has fallen 1.3% and only 40% of its component stocks closed higher on Friday since 12/20. With 60% of the Nasdaq 100 stocks declining during this period, why not be short or in cash, and go with the trend. So many of us lose money by staying long when the trend is down. The pundits scare us into believing the myth that we will miss the train when the turn suddenly comes. However, when a meaningful turn comes, there are many weeks and sometimes months during which we can hitch a ride.
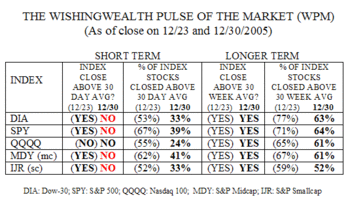
The WPM showed marked deterioration in all five indexes.  All indexes closed below their 30 day averages and are in short term down trends. Only 24% of the Nasdaq 100 stocks closed above their 30 day averages, along with 33-41% of the components of the other indexes. While all five indexes closed above their 30 week averages, only a reduced 52-64% of their component stocks did. Time will tell whether this longer term weakening will develop into a longer term down trend.
So we begin the new year in the midst of a confirmed short term down trend. For me, this is a time to be short or in cash. Can this trend reverse quickly? Of course. If the market turns up, I can turn on a dime, or dollar, along with the GMI. The key to conservation of capital is not to fight the current market down trend, especially in view of the strong bullish sentiment found among advisers. As always, the new year will bring tremendous opportunities for profiting on the bull and/or bear side, as long as I trade in harmony with the market trend and cut my losses quickly.
Please send your comments to: silentknight@wishingwealthblog.com.
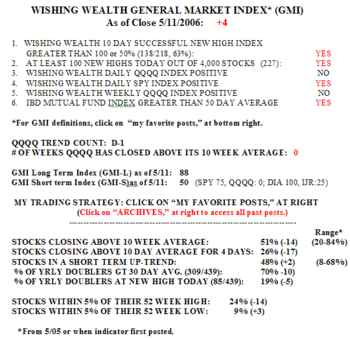
 Only 10% of the QQQQ stocks advanced on Thursday, along with 11% of the SPY stocks and 3% of the "strong" DIA stocks. Only 51% of the 4,000 stocks in my universe closed above their 10 week moving averages. The QQQQ is now in its first day of a new short term down trend (D-1)……….

