The GMI declined one, to 3 (of 6) and the GMI-R to 7 (of 10). I am not worried by this minor decline which was caused by my Successful 10 Day New High indicator’s turning negative. This indicator is very unstable when only a few stocks hit new highs 10 days ago. The QQQQ is now in its 9th day of a short term up-trend. I am making money again! The QQQQ is well above its 10 week average, which in turn is beginning to turn up. When the QQQQ is above its rising 10 week average I have the best chance of profiting from buying IBD 100 type growth stocks hitting new highs.
During the QQQQ’s recent 55 day down-trend, that index (Nasdaq 100) declined about 11% and 72% of its component stocks declined; 31% declined more than 15%. During that same period, 65% of the S&P 500 stocks declined, along with 70% of the Dow 30 stocks. Again, we see that when the QQQQ is in a down-trend, the odds are 2 to 1 that an individual stock will decline, not good odds for going long or holding stocks. On the other hand, going short would have worked very well. During this period of decline, QLD, the Ultra long QQQ ETF, declined about 24% while QID, the Ultra short ETF rose 22%. You can see that if one can identify market trends early, all that one has to do is to trade these two ultra QQQ ETF’s to earn a nice return. So, since the beginning of the new QQQQ up-trend, QQQQ has advanced 2.3% and QLD, 4.4%. By the way, one can buy these ETF’s and even write covered calls on them……
Some of my students are resisting the current up-trend because of all of the bad news about the economy. I reminded them that if one is crossing the street and sees a truck bearing down on them, one does not argue about whether the truck should/will stop or shouldn’t be acting that way. One must get out of the way or hop on board if it is going in the right direction. To wait for the economic news to turn good is to miss much of the move and to increase the odds of buying at a top. The news is usually worst after the market has already turned. As long as I have rules for getting out of my positions if the market returns to a down- trend, then I am content to go long now. The great speculator, Bernard Baruch, bought and sold his positions repeatedly in 1929 until he finally caught the major trend down. With commissions so low and having no tax consequences or wash sale rules while trading within my IRA, I can afford to go in and out of stocks until I catch the primary wave….
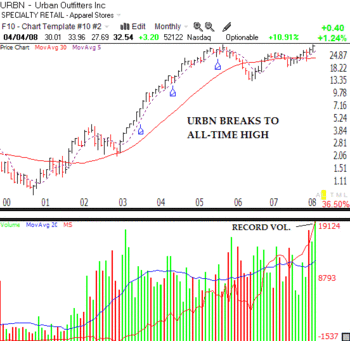
So I scanned the market for promising stocks and noticed that URBN, after rising 12x from 2003-2005, fell from grace in 2005 and went into a 3+ year consolidation. Well, URBN appears to be coming back to life. It is back on the IBD 100 list and has broken out to all-time highs on the highest volume since 1994. I’ll tell you a secret. 
One can often identify major break-outs by looking at a stock’s monthly chart. On February 25, I wrote "I also like FDG, which this monthly chart indicates has
had a high volume break-out to a new all-time high, breaking its peak
from September 2005." I said then that FDG looked like a long term cup-with-handle bullish pattern. When I wrote that post, FDG had closed at $49.06. It closed on Friday at $57.75. URBN looks to me like it has a similar bullish pattern, as long as it can get above $34. (Click on this monthly chart to enlarge.) I have no idea whether this stock will perform as well as FDG. But now that it is on the IBD 100 list in an up-trending market, I might be tempted to buy it and maybe even sell covered calls on it…..