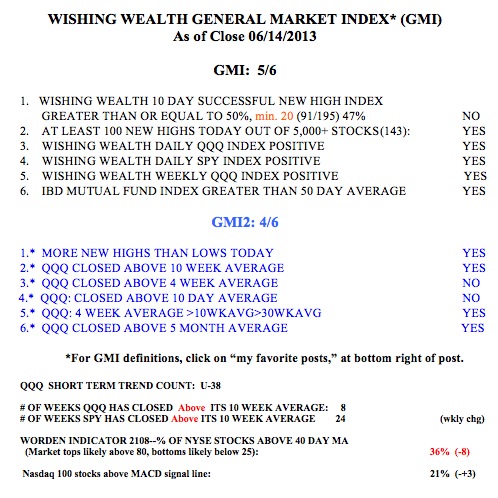
Short and longer term trends remain up.
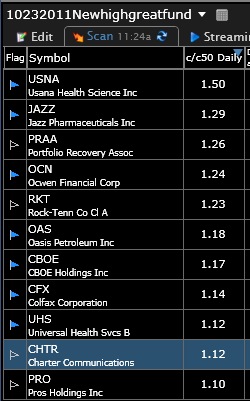
11 Stocks at new all-time highs with good recent earnings; I remain cautious
I ran my TC2000 new high and good recent earnings scan and the 11 stocks below came up. All are above their green line base tops and are therefore at all-time highs. I sorted them by price appreciation over the past 50 days. For example, USNA has advanced 50% over its price 50 days ago. Seven of the 11 have a blue flag, indicating they appear in one of the lists of stock I maintain that have been mentioned as promising stocks by IBD……
The GMI remains at 5 but my short term indicators are weakening. A close of the QQQ below 71.55 might turn my short term indicators negative. Stay tuned. I remain cautious and am hedging my long positions with some SQQQ (leveraged bearish QQQ ETF).
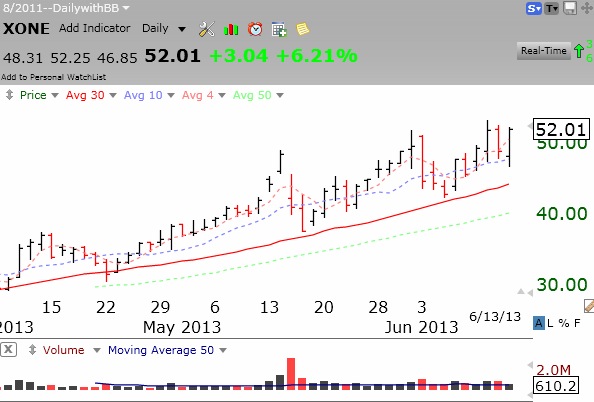
IBD: Market up-trend resumes, so doe XONE
After only two days since calling a correction, IBD now sees the market back in an up-trend. I am not the only one who can get whip-sawed by this market. The GMI Buy Signal remains in effect since late February. It will be important to see if the snap back rally on Thursday can continue into next week. Interestingly, XONE, came right back with the market on Thursday. I am holding this position, based on the exciting 3D printing concept. Note how XONE has found prior support at its 30 day average (red line). The ideal buy point for me would be at that average, but who knows if it will bounce there again? It all depends on the strength of the market.