It remains to be seen whether this bounce will last and turn into a new short term up-trend. With the 30 day average of the QQQ curving down, I expect more weakness. There were only 72 new 52 week highs in my universe of almost 6,000 stocks on Thursday.
8th day of $QQQ short term down-trend; $GLD in Stage 1 base?
GMI-2 falls to zero, with all indicators negative. I am mainly in cash. This is an unusually good description of how bad this market decline is.
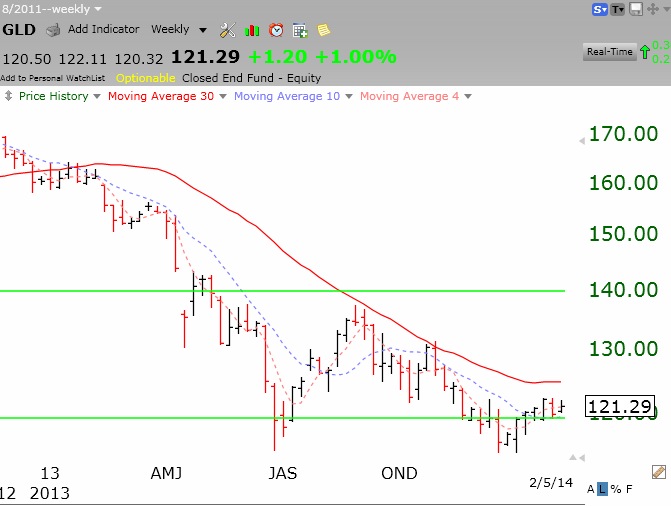
It looks like gold is forming a Stage 1 base. The gold ETF, GLD, formed a double bottom around 114.50 and appears to be forming a base. Gone are the pundits talking about gold reaching $2,000 or $3,000 per ounce. As they now proclaim that gold has more to fall, it probably will start to rise. I am nibbling at GLD. Here is its weekly chart. As always, watch the chart, not what the pundits say.
7th day of $QQQ short term down-trend; $EQT and $COG at new highs
Mainly in cash in my trading accounts. I have a small position in SQQQ.
I am, however, keeping an eye on stocks that can survive this decline and hit a new 52 week high. Only 4 stocks came up in my good fundamentals and new high scan. All are recent green line break-outs. These are EQT, COG, DXCM and RENT. I like EQT and COG (I own a little) the most. Any stock that can reach a new all-time high in this market is worth watching for future strength.