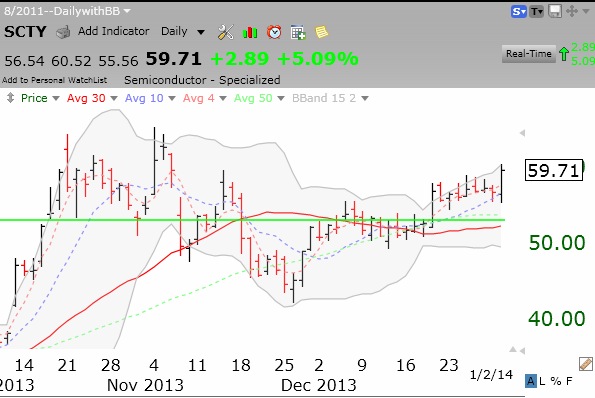
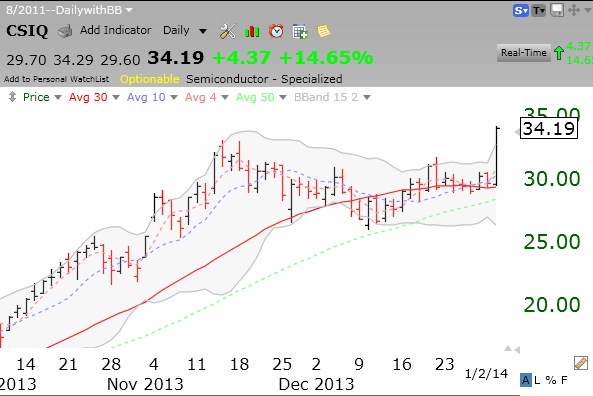
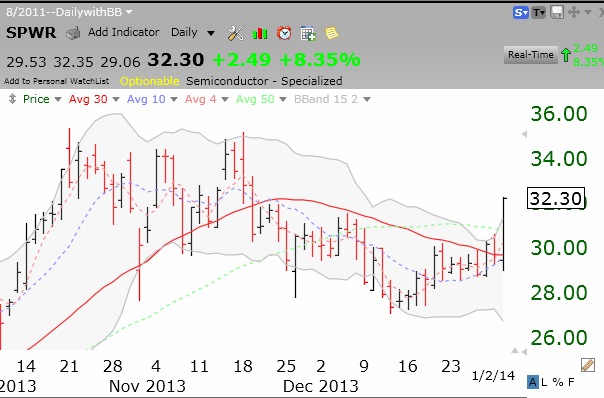
In a down day Thursday, solar stocks shined. Check out these daily charts. Perhaps this market is developing a sunny disposition….
Stock Market Technical Indicators & Analysis
In a down day Thursday, solar stocks shined. Check out these daily charts. Perhaps this market is developing a sunny disposition….
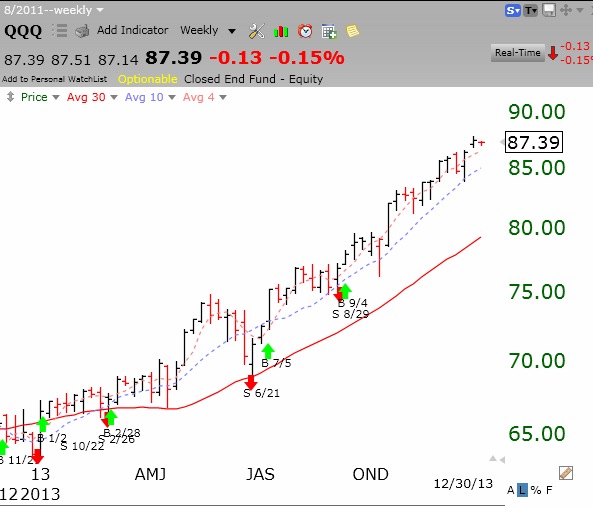
With the Investor’s Intelligence poll showing almost 60% bulls and 67% of the Nasdaq 100 stocks having an over-bought stochastic, I am becoming more defensive in my trading accounts.