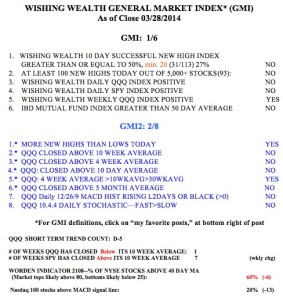
The GMI could signal a Buy with a strong day on Tuesday, even as the GMI-2 sinks to 1. This is a very split market with the tech and growth stocks lagging. I remain mainly in cash. Will stocks rally with earnings? Meanwhile, gold is breaking down and the Stage 2 advance appears to be over.
5th day of $QQQ short term down-trend; $FANG shows strength
Monday is a critical day for the market. The QQQ is over-sold and it will either bounce or begin a significant decline. The key is to wait for the end of the trading day, around 3:45 PM, to see where the market will settle. Right now I remain mainly in cash in my trading accounts, with a small position in SQQQ.
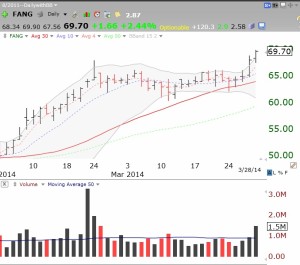
I ran my scan for stocks that reached a 52 week high on Friday and had good recent quarterly earnings. Almost one half of the only 17 stocks that came up were involved in energy. Three of the energy stocks (EOG, WGP, FANG) have been on the IBD 50 list or in their New America column. If the market turns up, I prefer FANG. Check out its daily chart below. Note the 30% rise in February, followed by a 5 week consolidation. FANG has just broken out and now has expanding Bollinger bands.
But with the GMI on a recent Sell signal, I will keep my powder dry and wait for a change in trend to go long again. Note that the QQQ is now back below its critical 10 week average. In contrast, the SPY is still above its 10 week average. This decline has targeted biotech and growth stocks.
4th day of $QQQ short term down-trend; GMI flashes Sell; mainly in cash
With the GMI turning to Sell, I am in cash with a very small position in SQQQ in my trading accounts. The longer term trend remains up. On the other hand, the QQQ is very over sold, with a low daily 10.4 stochastic, and it could bounce at anytime. Sentiment in my class on Thursday was also quite bearish. That is why cash is the safest place for me now.

