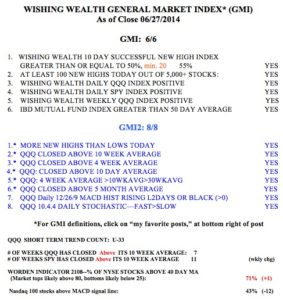
All GMI components are positive.
 SPY remains in a Stage 2 up-trend (weekly charts):
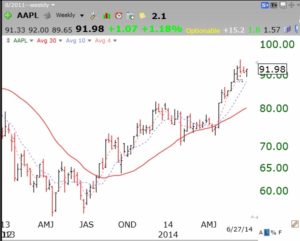
As is AAPL.
 See you at my AAII work shop on July 19?
Stock Market Technical Indicators & Analysis
All GMI components are positive.
 SPY remains in a Stage 2 up-trend (weekly charts):
As is AAPL.
 See you at my AAII work shop on July 19?