IBD stills sees market in correction and the GMI remains on a Sell signal. I did close out my position in calls on QID on Wednesday.
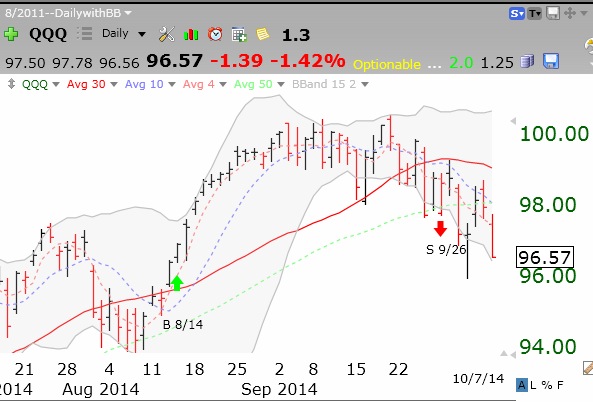
8th day of $QQQ short term down-trend; riding the inverse QQQ ETF, $QID
My call options on QID rose on Tuesday, making my entire account rise. I am mainly in cash in my trading accounts with a few small longs that are hedged by my call options. For those of you new to the inverse ETF’s, QID is designed to rise 2X more than the QQQ declines. Thus QQQ declined -1.4% and QID rose +2.9%. My call options on QID give me leverage and reduce my risk because I can only lose the price of my options if I am wrong. This daily chart of QID illustrates how it has been rising lately with large black volume spikes.
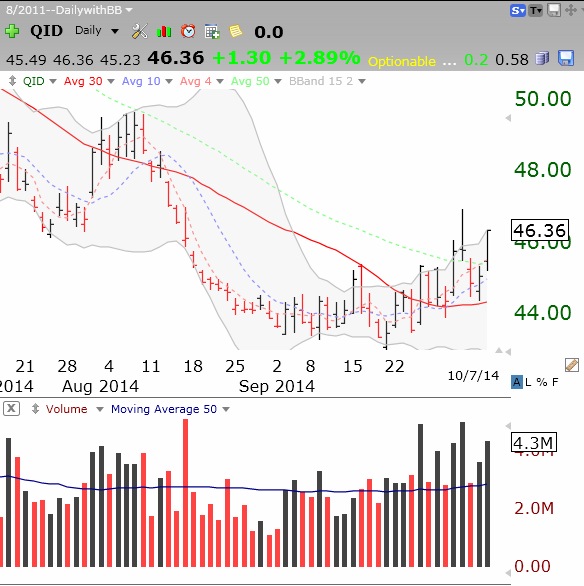 The chart of QID is the inverse (opposite) of its underlying index, QQQ.
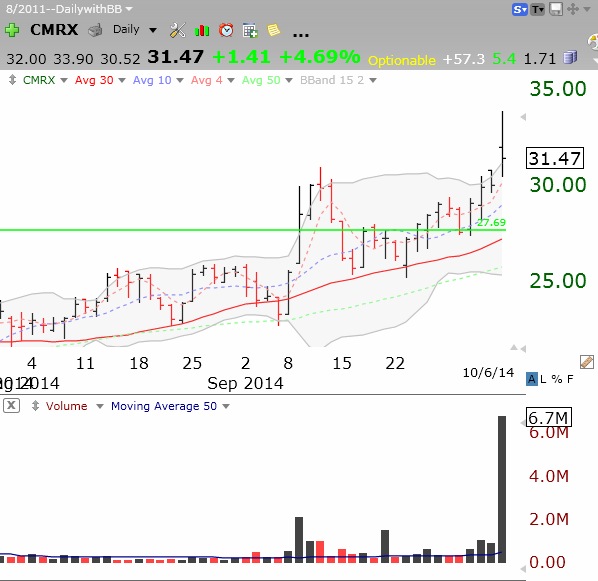
7th day of $QQQ short term down-trend; $CMRX–I told you!
In Sunday night’s post I listed a number of biotech stocks that had had high volume green line break-outs. I said that some of them may be sitting on new cures. Little did I know that CMRX would have a drug to fight Ebola. Technical analysis works!