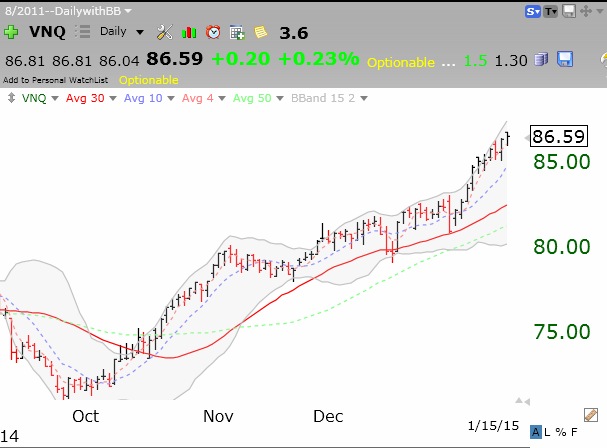
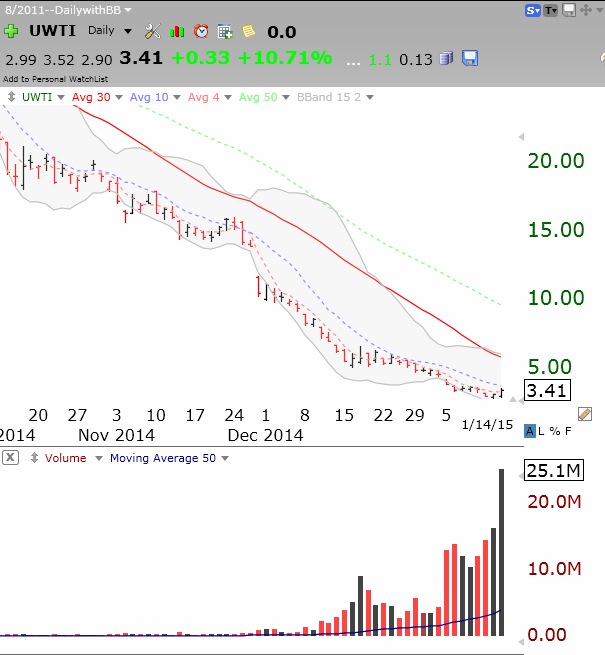
TSLA, which had a green line break-out last week, rocketed higher Wednesday evening after it released earnings. Check out this weekly chart.
6th day of $QQQ short term up-trend; FB climbs after green line break-out–writing covered weekly calls on FB and GLD
All of my indicators remain positive.
Given the strong market up-trend, I am looking for some stocks in strong Stage 2 up-trends which have recently broken above their green line base. Facebook (FB) is a perfect example, as this weekly chart shows.
FB broke above its green line top (all-time high base of at least 3 months) in September, re-tested that line in November, and now is in a nice up-trend. Also positive is that FB came public in the last 2 years and has earnings that are increasing at triple digit rates. I bought some FB and sold weekly out of the money calls on it. I am content to collect time premiums for FB that equal more than 1% each week. Writing weekly covered calls on stocks and ETF’s appeals to me because the position lasts only a week and can deliver large time premium income. Every Friday I can reassess whether I want to repeat the trade again. Alan Ellman and I will be doing a workshop on covered calls for the DC Metro AAII Chapter in July. Alan’s books, listed on the lower right of this blog page, are a great way to teach oneself about covered calls.
I am also writing covered weekly calls on the gold ETF, GLD. Gold looks to me to be in the beginning of a Stage 2 up-trend. Check out this weekly chart. GLD is now above its critical 30 week average. It will be in a full Stage 2 up-trend if the 30 week average (red line) curves up. Meanwhile, I am content to collect time premium income each week.
Click here for a CBOE list of weekly options on stocks and ETFs.
Further Thoughts for DC Metro AAII; $QQQ remains in Stage 2 up-trend; $TSLA– green line break-out
I spent a wonderful morning Saturday presenting a workshop to the DC Metro AAII Chapter. The audience of primarily Boomers was very appreciative of my rather conservative presentation. I stressed the desirability of focusing more on ETF’s than individual stocks in order to lessen volatility and stress levels.
As always, I recalled some points I wish I had made. First, all should investigate the use of U.S Government I-bonds for ultra safe money. These are U.S. savings bonds that adjust every 6 months to the level of inflation. Thus they are very safe and their yield will rise if interest rates do. They will not fall in value like regular bonds can when rates rise. Read all of the rules on I-bonds here. I believe they are better than CD’s or savings accounts. The current yield is 1.38%
I also wanted to tell new readers that they can have the GMI stats mailed to them every day by entering their email address in the box to the right of this post. I do not release your email address to others. The box by which to subscribe looks like this:
You may also view my Houston TC2000 webinar from 2012 by clicking the link to the right side of this page.
As to this market, all of the indicators in the GMI and GMI-2 are positive. Furthermore, the GMI flashed a Buy Signal on 2/12. Friday was also the 5th day of the new QQQ short term up-trend. The longer term up-trend is very intact. Look at the Stage 2 up-trend in the weekly chart of the QQQ. The QQQ is nicely above it rising 30 week average (solid red line).
Hopefully this nonsense about the Dow chart looking similar to its chart from 1929 has dissipated. This market looks no way like the one in 1929 leading up the the great crash. But the market climbs a “wall of worry” so bring on the whiners. I will become concerned when the pundits start saying that the market has nowhere to go but up….
I have been talking about a bottom in gold (GLD ETF) for several weeks. Last week GLD closed back above its 30 week average for the first time since January, 2013. I think it is early, but we might be seeing the beginning of a Stage 2 up-tend. I have been buying GLD and writing weekly calls on the position. The return is about 3% per month on my investment. Check out this weekly chart of GLD. Note the double bottom around 114.50 and the flattening 30 week average.
Finally, TSLA had a green line break-out last week. It will be interesting to see if the stock surges after earnings are released this week.
Here are the GMI stats: (click on to enlarge)