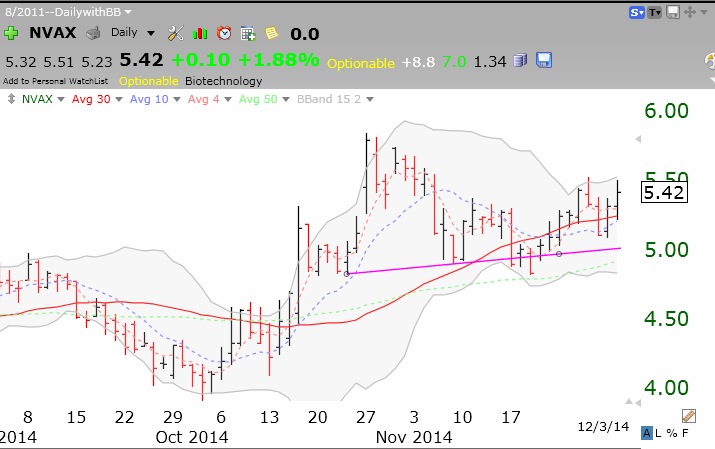
Gold ($GLD) in Stage 1 base; $XSW in Stage 4; $QQQ H&S top still possible

GMI2/6

I have not talked about gold for quite a while.   This weekly chart shows that after the huge Stage 4 decline from the top through most of 2013, GLD has formed a double bottom (around $114) and is now building a classic Stage 1 base.   Note that GLD is now resting upon its flat 30 week average (red line).   If the 30 week average starts to curve up, signalling the onset of a a new Stage 2 up-trend, I will become interested in owning GLD again. I ignore the news and media pundits and rely on the price action to inform my trading decisions. (Click on chart to enlarge.)

GLDwkly05092014

By the way, a sector with an ominous chart is software, measured by the ETF, XSW.   The long Stage 2 up-trend is over and XSW may be entering a Stage 4 decline. Compare XSW’s chart to that of GLD about one year ago. History does not exactly repeat–but it sure rhymes.

XSWwkly05092014

Finally, I alerted you recently to a possible head and shoulders top formation in the QQQ.   As this weekly chart shows, the right shoulder (noted by the S?) may have   formed.   Note also that the QQQ is resting on its critical 30 week average (red line). We need to watch this pattern very carefully because a break of support would likely result in a significant decline. Furthermore, it is quite evident from the chart that QQQ has returned to the same level at which it began 2014. That is a long time for this important index ETF to tread water. Market tops typically take a while to form….

QQQheadandsh0509

Given this malaise in tech stocks, it is noteworthy that the GMI is at 2 (of 6).   The more sensitive GMI2 is at 2 (of 8). The market is still split with the SPY closing above its 10 week average for 4 weeks while the QQQ has closed below its 10 week average for 7 weeks. With IBD still calling the market in a correction, this is the time for me to be defensive and to take minimal risks.


New $QQQ short term down-trend–but I don’t trust it

GMI4/6
GMI-23/9
T210858%

While my objective criteria for a short term down-trend have been met, I do not trust it.   If you take a look at this daily chart you will see that each time the QQQ bounced from its lower channel trend line, it was also bouncing up from the lower Bolinger Band (BB).   The space between the upper and lower bands is shaded gray in this chart. To me, the lower BB is a better indicator of potential support.   So on Wednesday the QQQ bounced off of its lower BB, suggesting that we will now get a rise in the   QQQ, but only to the top BB. We are headed for a BB pinch (thanks $Bill). At some point the BB will break up or down with a new move. I have also indicated before that I tend to trust a new short term trend only when it reaches day 5. Since 2006, 41% of short term down-trends lasted 5 days or less.   So, even though the GMI remains on a Buy signal, I am waiting mainly on the sidelines until Mr. Market reveals his true direction. Click on chart to enlarge.

QQQdaily05072014