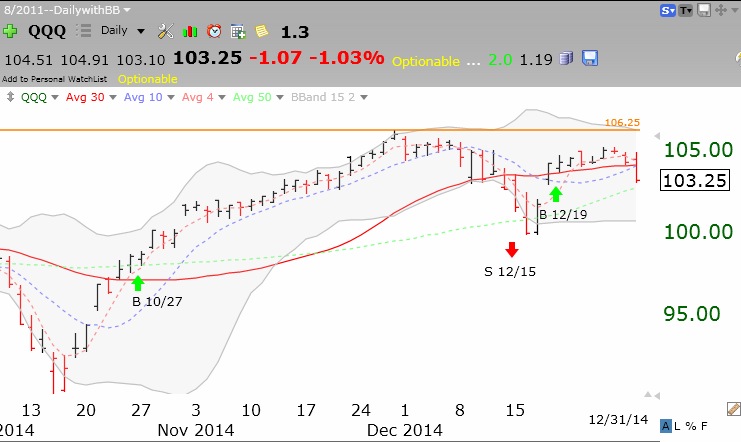
The QQQ short term up-trend has completed 8 days. Note that the sensitive GMI-2 has declined to 3 (of 8) A flat or down day on Friday would begin a new QQQ short term down-trend. This would be quite ominous because it means that the rebound from the mid-December decline is likely over. The fact that QQQ could not go on to a new high is very troubling, especially if QQQ closes below the recent decline’s bottom of 99.96. I am holding a position in SQQQ (3x bearish QQQ ETF) just in case a new down-trend begins. If the QQQ declines I will add more SQQQ. However, if the QQQ holds, I will exit and go back into TQQQ. I am willing to take a few small losses because when a real trend develops I will make it all back and more. Below is a daily chart of the QQQ. Note the comparatively weak recent rebound from the December decline, compared with the rebound from the October swoon.
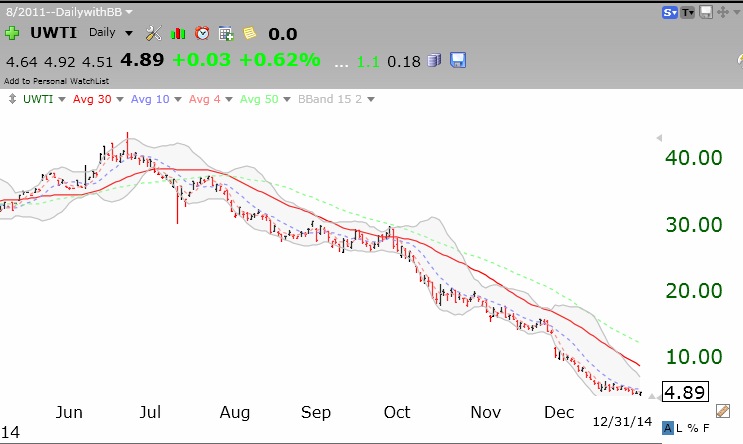
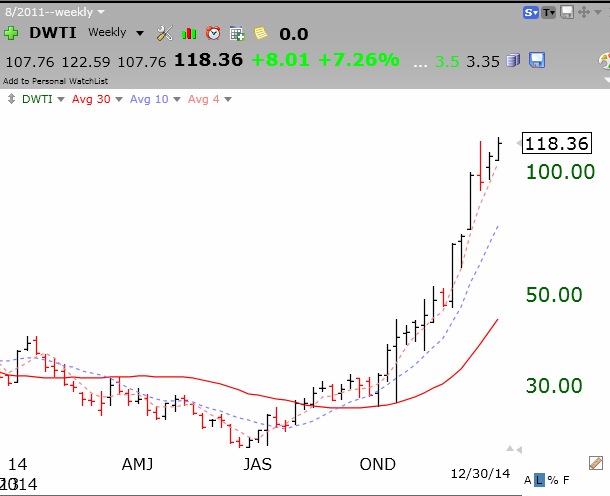
Last post I showed you how the 3X bearish oil ETN, DWTI, rocketed up as oil plummeted. It got me thinking about what will happen when oil finally bottoms out and starts to recover. It turns out there is a 3X bullish counterpart to DWTI, UWTI. I bought a little just to keep it on my radar. When oil turns around UWTI could rocket higher. At a cost of under $5, I am willing to take on the risk.