Markets remain in the range bound technical channel.
New $QQQ short term down-trend; will channel hold again?
The markets failed to hold early gains after AAPL’s great earnings release. The QQQ short term up-trend lasted only 3 days. IBD now sees the market up-trend under pressure. The market appears very treacherous to me. I increased my position in SQQQ and I am gradually selling my longs. Once 4th quarter earnings are out there is little to propel this market higher. The QQQ remains in the downward sloping channel. The big question is whether support will come in again (for the 4th time) at the bottom of the channel, drawn in this daily chart of the QQQ.
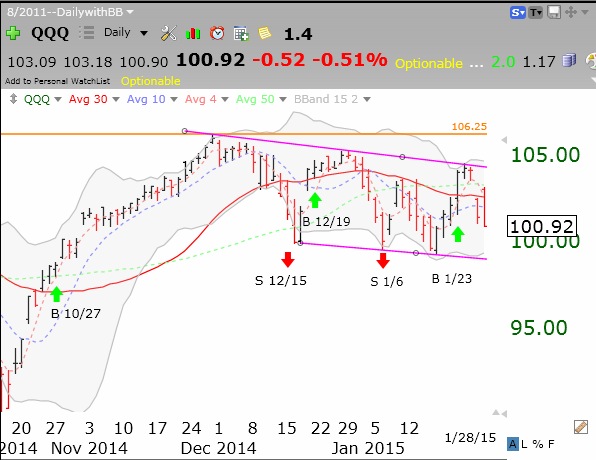
A huge sign of technical weakness is that the SPY and DIA have now closed below their critical 30 week averages.
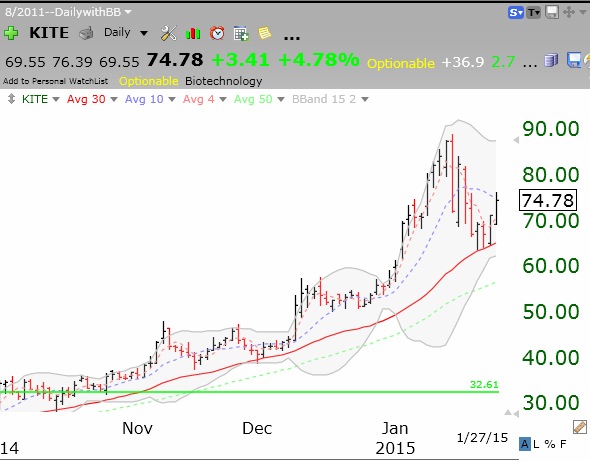
3rd day of $QQQ short term up-trend; $KITE soars
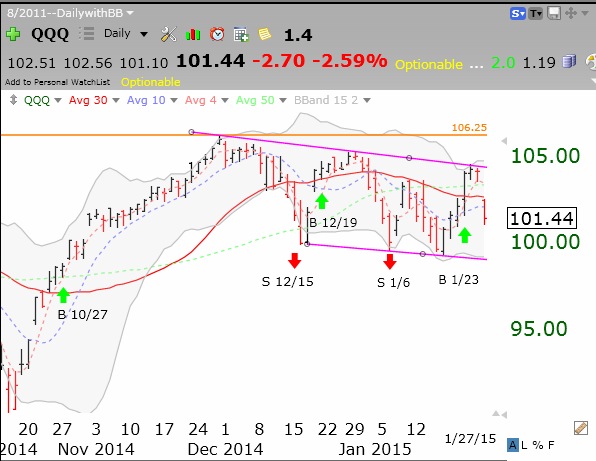
The QQQ reversed down from resistance on Tuesday. With AAPL rebounding after hours it remains to be seen whether this strength will rescue the QQQ on Wednesday. The SPY and DIA are much weaker. Wednesday’s close of the QQQ will be very important to discerning the short term trend of this market.
 Maybe I should go fly a KITE.