14th day of $QQQ short term up-trend
Some signs of short term weakening are appearing. First, a lot of my holdings were rapidly climbing. When that happens the market is often near a short term sell-off. Second, I find that the QQQ and AAPL are up against resistance and thus more likely to retreat than to advance. Lastly, I have noticed that the market tends to be strong at the end of the month and then weak at the beginning of the new month. I therefore took some money off of the table on Friday afternoon. I do not want to give back a lot of my recent profits.
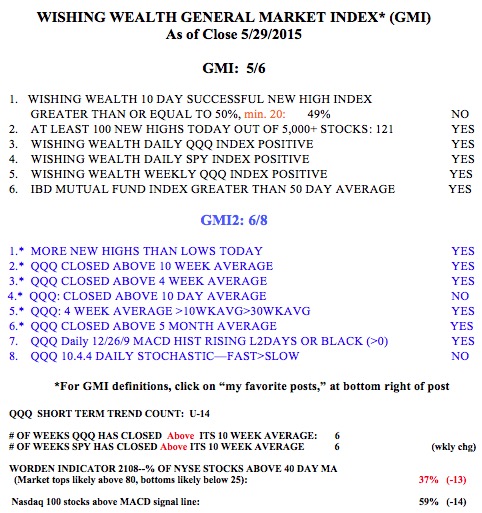
The GMI has now weakened a little to 5 (of 6) and the more sensitive GMI2 is at 6 (of 8).
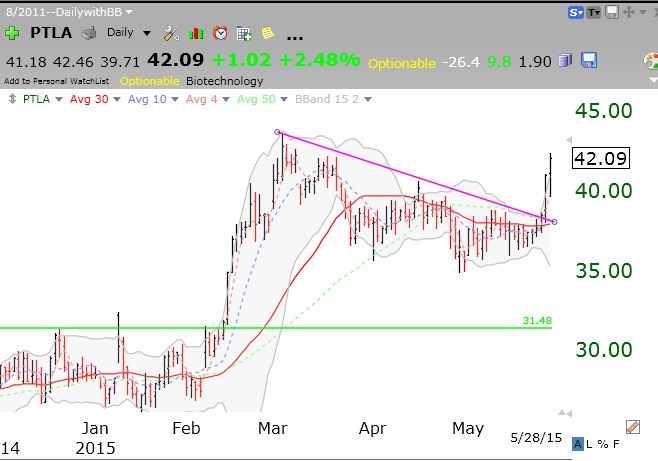
13th day of $QQQ short term up-trend; $PTLA , $IMAX and $SYNA shine.
Many of you wrote me to ask whether you can receive my TC2000 alert emails. I send them only to students in my university class on technical analysis. I have trained my students to understand my approach and how to interpret my signals. One day I might offer my course and the alerts to a wider audience.
PTLA is a biotech that my stock buddy, Judy, first told me about. It has had a green line break-out, a subsequent consolidation, and is now rising again. I own it.
 Remember I wrote about IMAX when it had a green line break-out. Look at Thursday’s action!
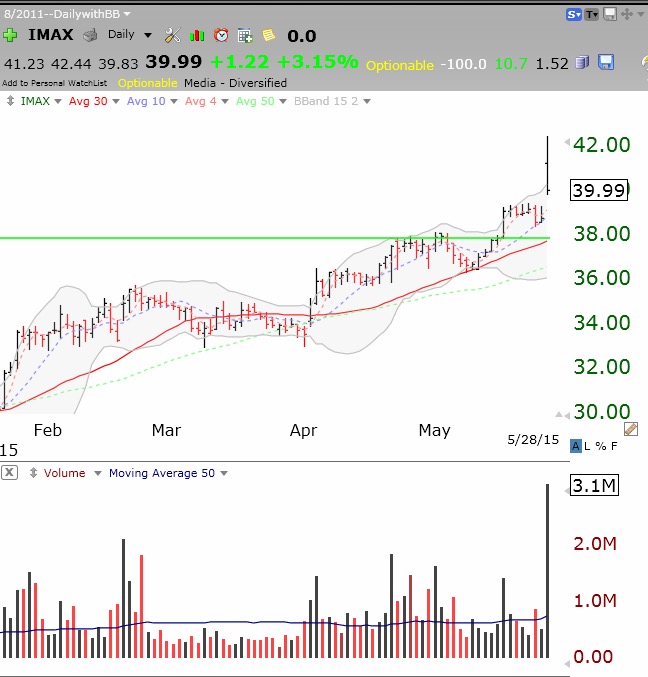 Note the many high volume up-days (black volume spikes) since April leading into the green line break-out. Traders with deep pockets were buying before the big announcement. By reading the chart signals one could ride along with them.
SYNA is another recent successful green line break-out.
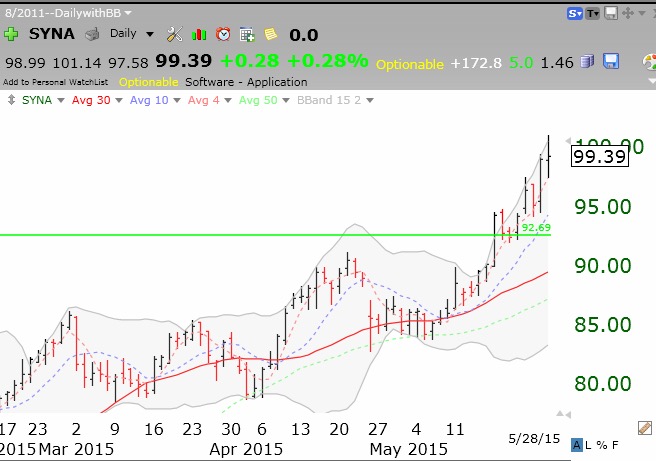 I sell any green line break-out that declines back below its green line, and buy it back if it comes back above it. To see a webinar I did on green line break-outs, go to the link on the right for my December 2012 webinar.