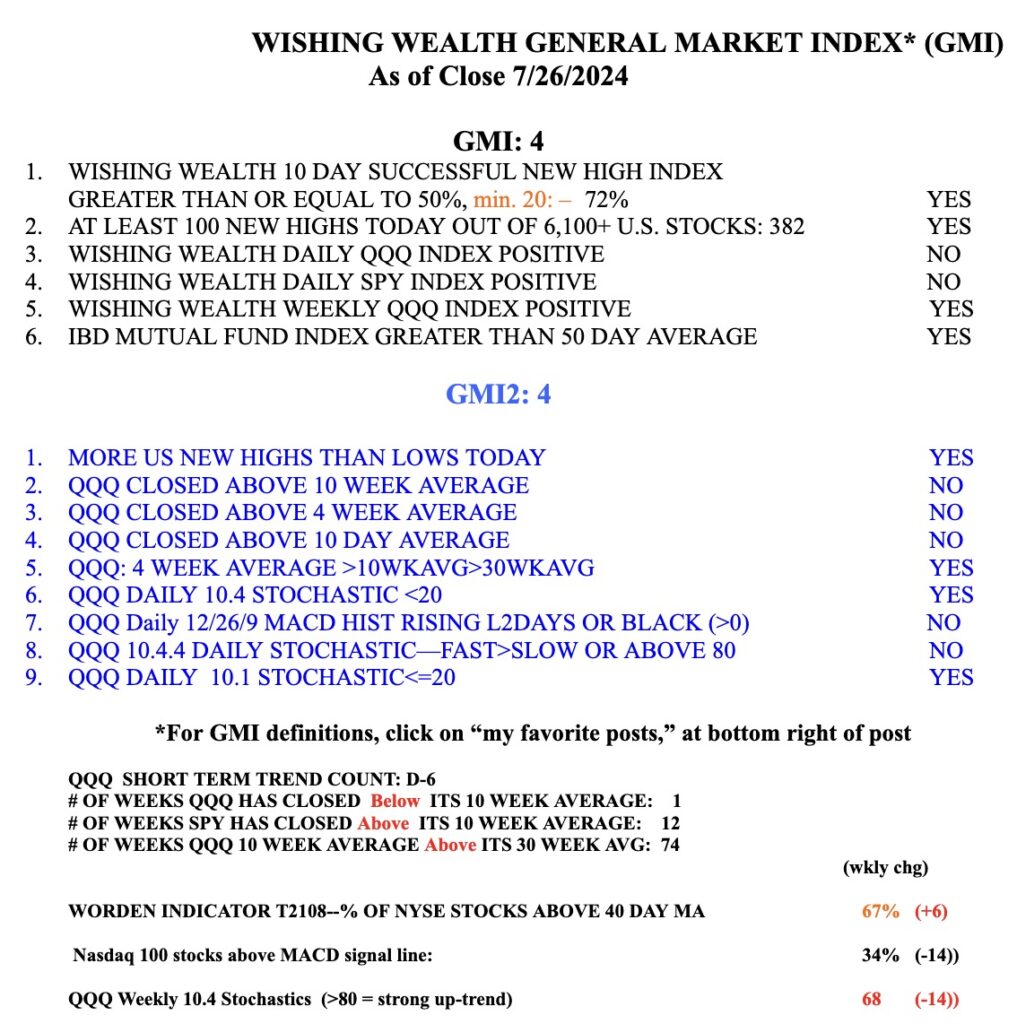
Blog Post: Day 6 of $QQQ short term down-trend; GMI=4 and GREEN, see table; $QQQ is now below its 10 week average; Is QQQ heading towards a daily BWR down-trend?
My adapted Guppy chart shows that a BWR down-trend pattern may be forming. Until QQQ closes (shown by dotted line) above all 12 of the red/blue averages, I will not go long TQQQ, or buy any Nasdaq 100 stocks. Look at the turnaround pattern that occurred last May. The key to success is to not go long until AFTER an up-trend is apparent. Access my blog at: www.wishingwealthblog.com.

The GMI remains GREEN at 4 of 6. The weekly 10.4 stochastic is only at 68. Strong up-trends remain above 80.

Blog Post: Day 5 of $QQQ short term down-trend; BUT 329 US stocks at new highs, 28 lows and 67 at ATH; NONE of the stocks at ATH come from Nasdaq100 stocks–funds have rotated out of the prior leading tech stocks in QQQ!!!!
I usually focus on the QQQ to gauge the market because tech stocks are often among the growth leaders. I have never seen before a collapse in QQQ while the number of US stocks hitting new highs or all-time highs (ATH) was climbing. Note that T2108, which tracks NYSE stocks above their 40 day average of price, is at 61%. Only 20% of the 67 US stocks reaching an ATH today were on my growth stock watchlist!!! None were among the Nasdaq 100 stocks tracked by QQQ! This is very rare. I am out of the market now because I typically focus on stocks in the QQQ ETF. If I want to trade stocks now, I would have to focus on the many other stocks that are hitting ATHs. Here is a list of some of the US stocks that reached an ATH today that were not on my growth stock watchlist. Many of them were regional banks or in insurance. These are areas I would not normally invest in. Get the full list on my blog post at www.wishingwealthblog.com.
