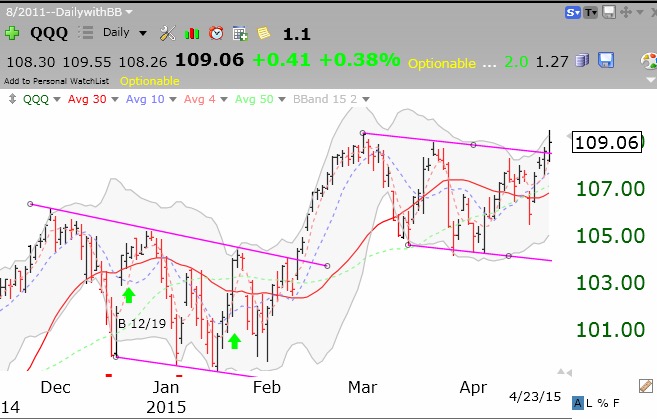
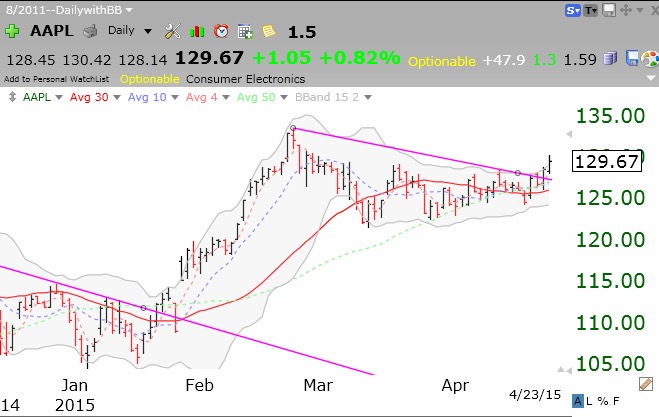
Helped by AAPL, the QQQ broke out of its channel on Thursday.
Stock Market Technical Indicators & Analysis
Helped by AAPL, the QQQ broke out of its channel on Thursday.
Will QQQ hold channel break-out?
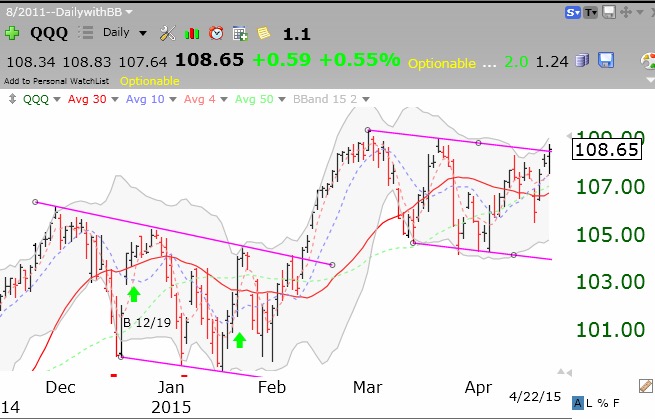
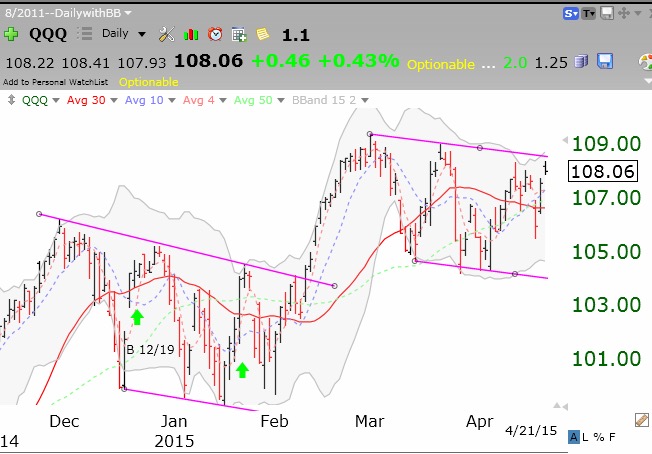
GMI back to 6 (of 6). QQQ is near top of channel.