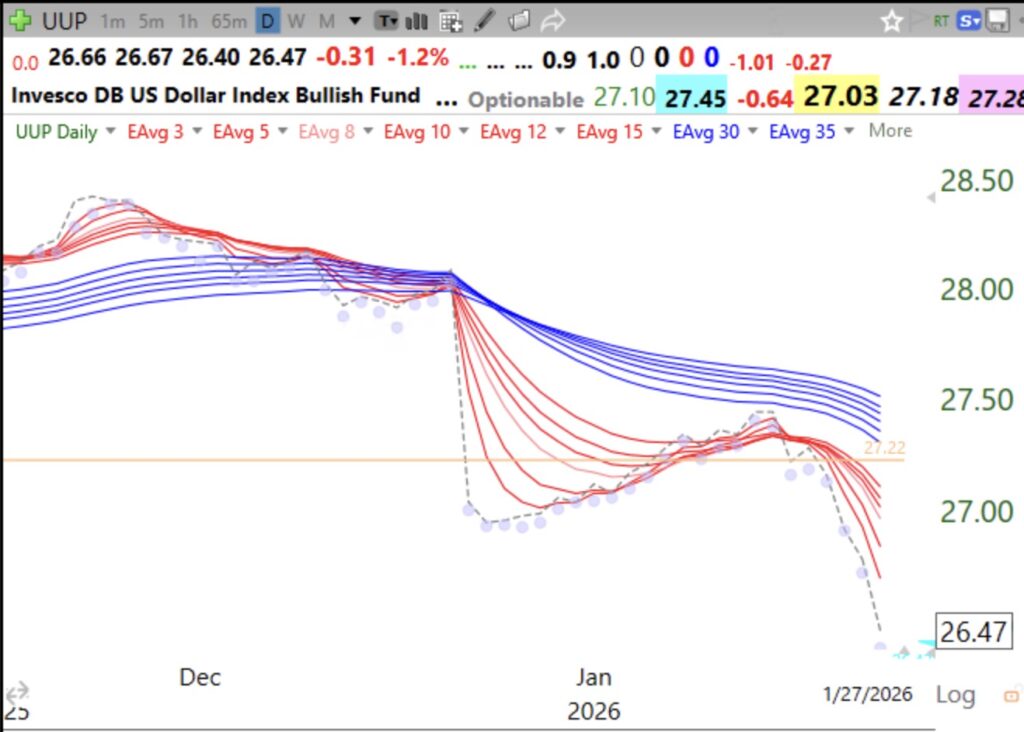
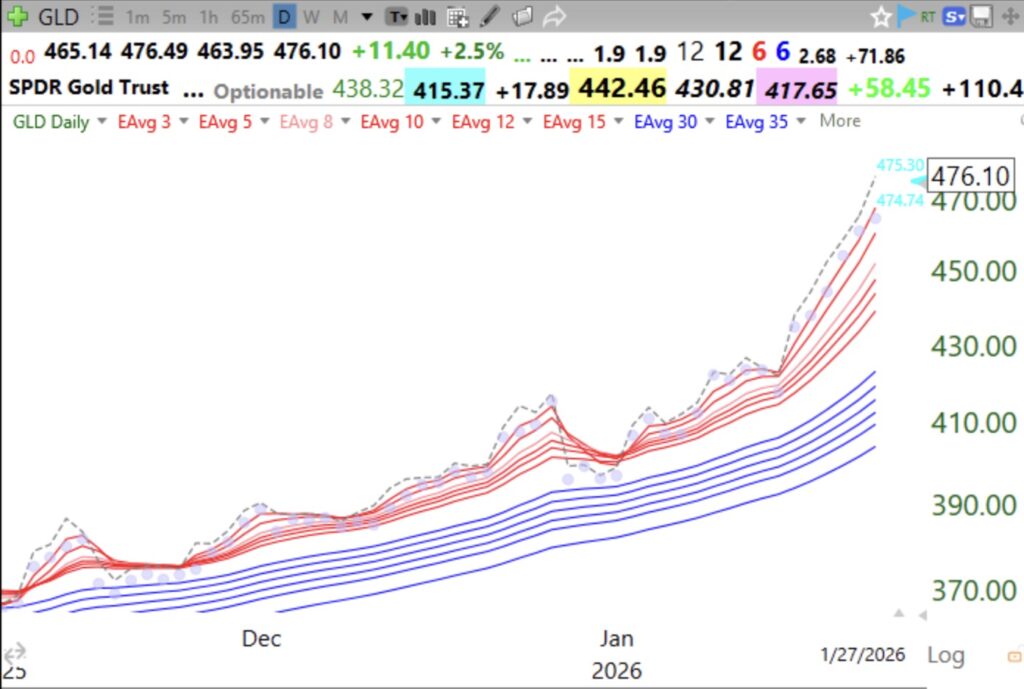
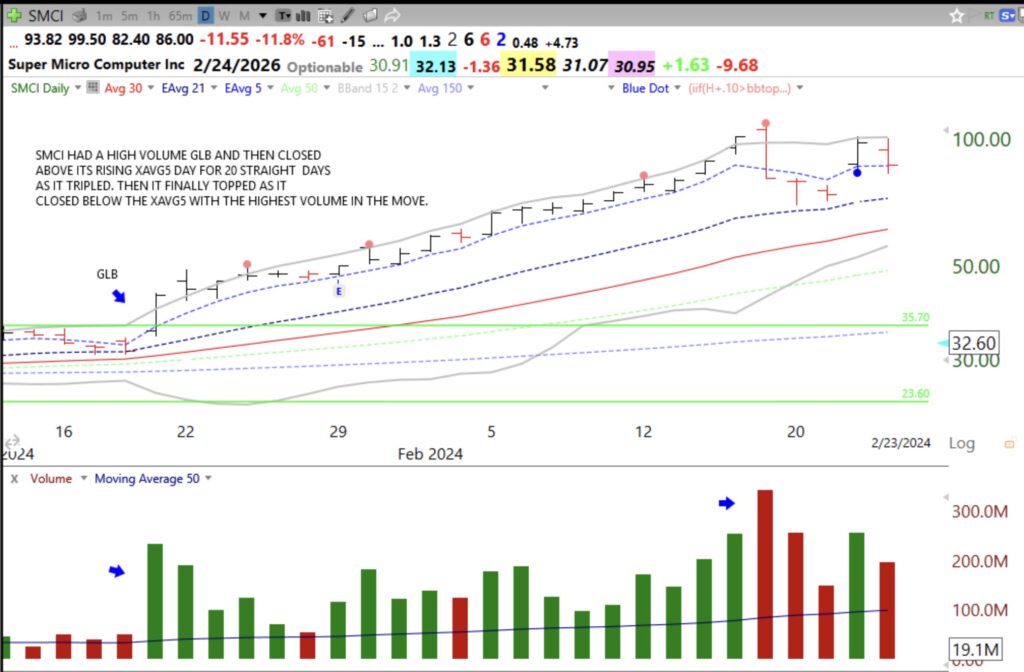
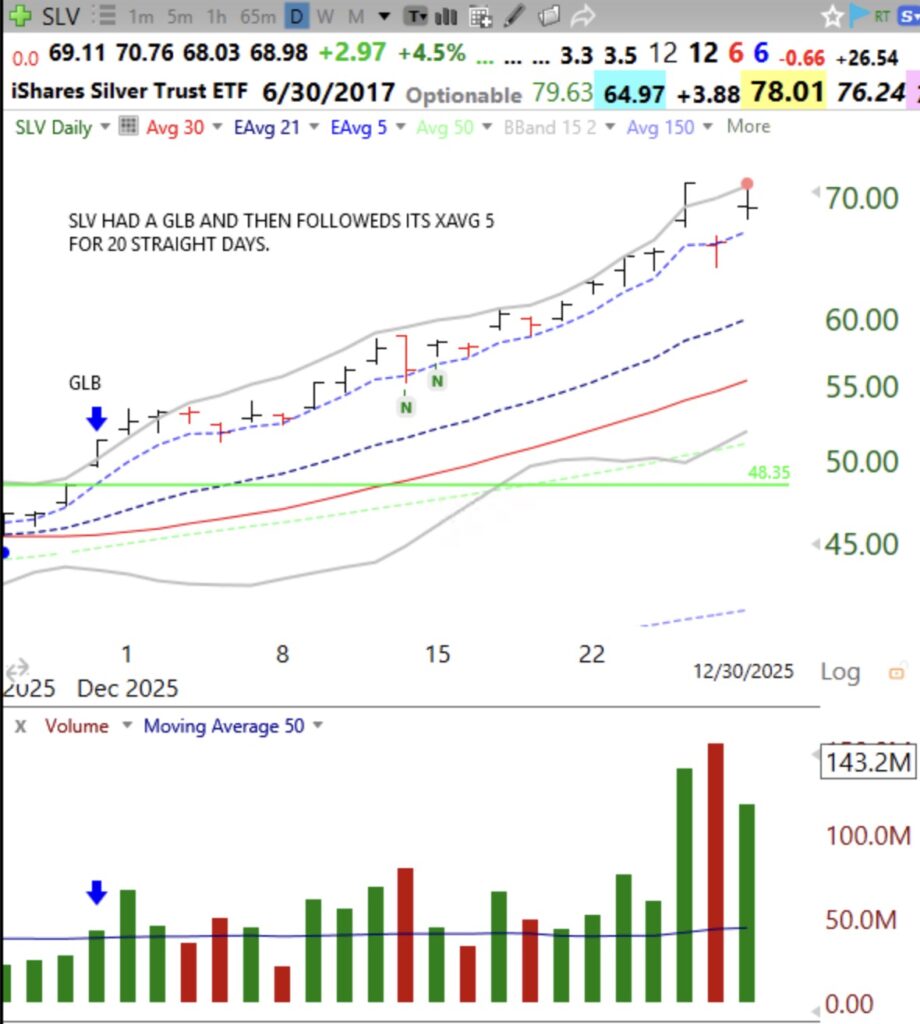
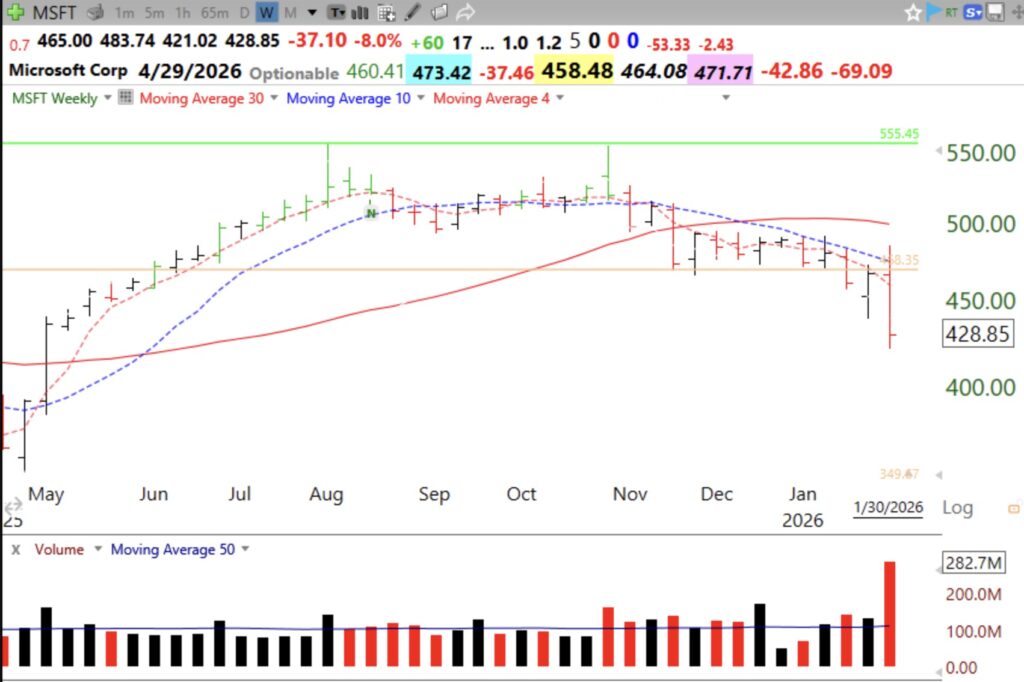
IBD reports that the Investors Intelligence poll shows 61.5% of advisors are bullish. This is close to the 5 year high of 64.2% and a level of bullishness that often occurs near market tops. The extreme action of GLD, SLV and MSFT last week was ominous. MSFT has entered a Stage 4 down-trend, see chart. I am retreating to cash in my trading accounts. I am a chicken.
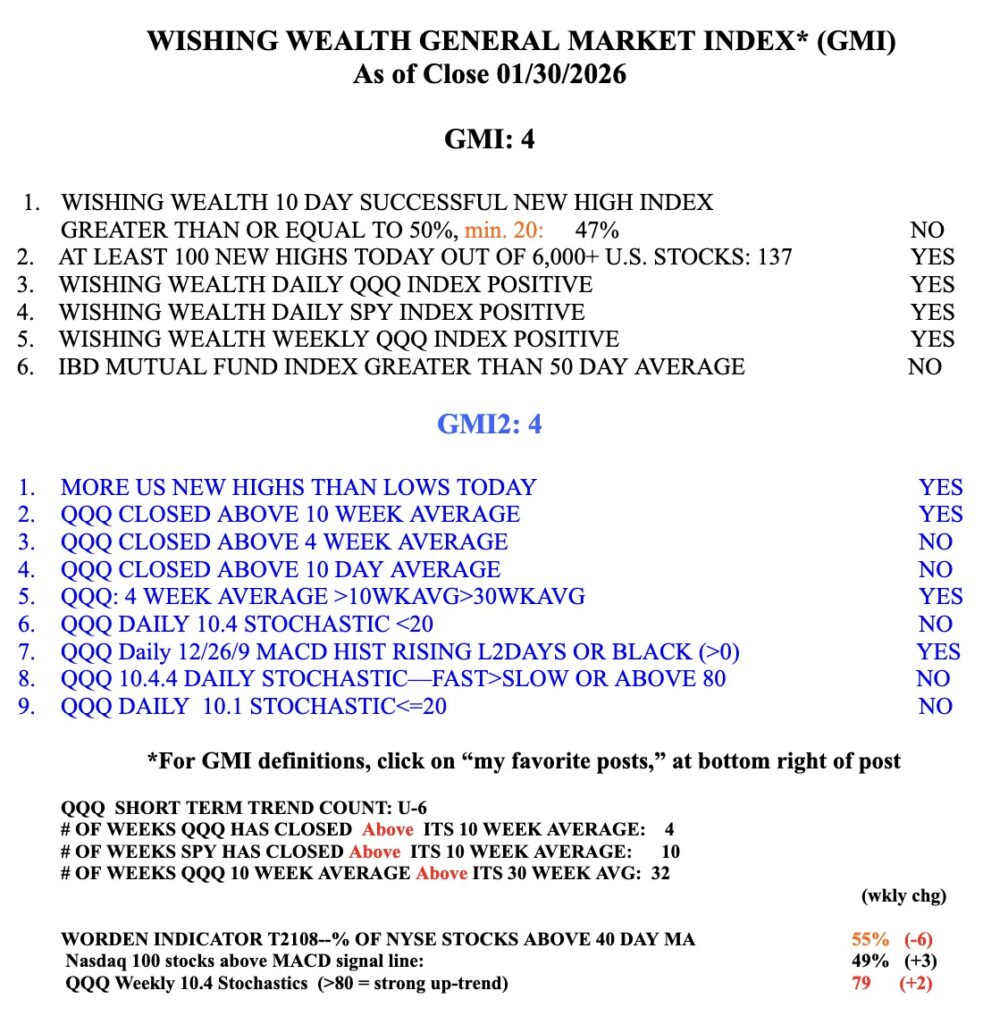
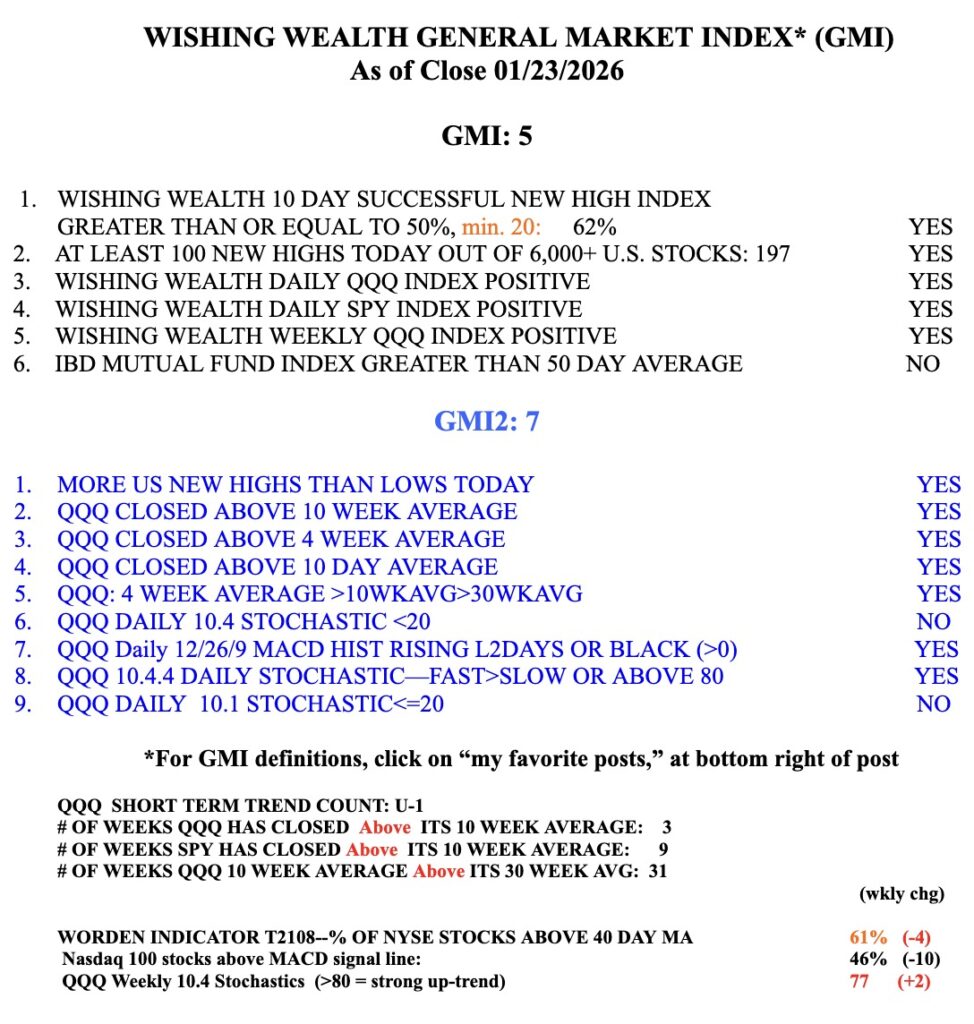
The GMI=4 (of 6).